 |
Welcome to the new cutting edge in trading strategy backtesting
software: "Diamond Backtesting with Walk Forward Manager (BTWFMgr)"
(developed by Professional Software Solutions - 30+ years software development) (Risk Disclosure) |
Diamond Backtesting with Walk Forward Manager (BTWFMgr)
|
Welcome to the new cutting edge in trading strategy backtesting
software: "Diamond Backtesting with Walk Forward Manager (BTWFMgr)"
(developed by Professional Software Solutions - 30+ years software development) (Risk Disclosure) |
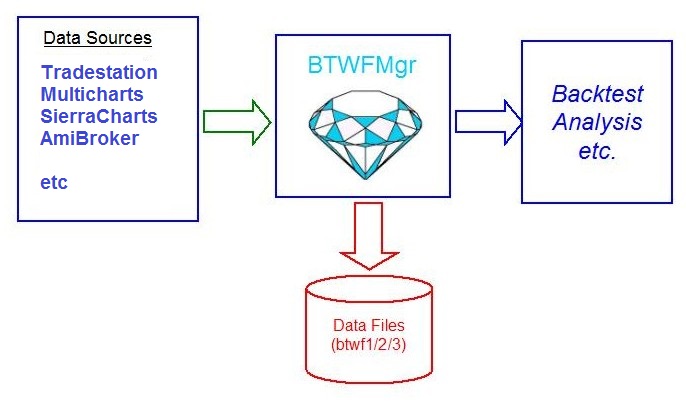
The new BTWFMgr offers the following:
BTWFMgr can work with any data source, because
BTWFMgr uses a modular approach, which translates the various data sources into a
standard btwf1/2 format:
BTWFMgr works now also with Sierra Charts
- with the new "Sierra Charts Backtester
(PssSCBT)" module!
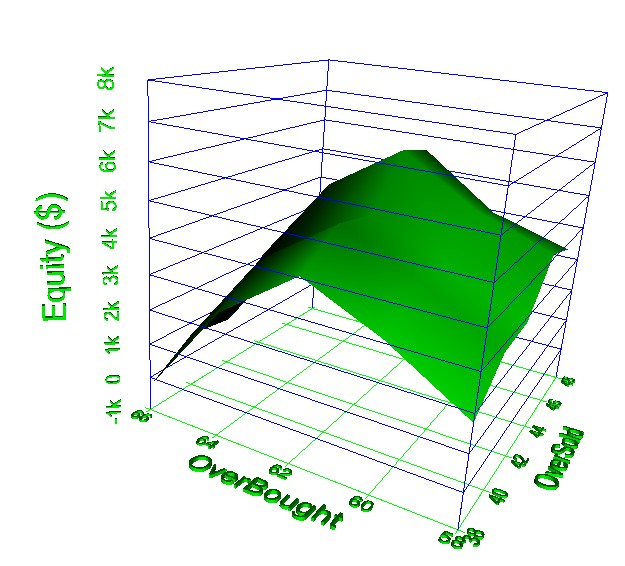
BTWFMgr allows you to detect the effects and impact of two
parameter settings on the overall result.
This helps you to make sure your backtest is covering the optimal range, or if
you have to widen the testing range.
In the example below we show the RSI oversold/overbought parameter - showing an
optimum at around 64/46:
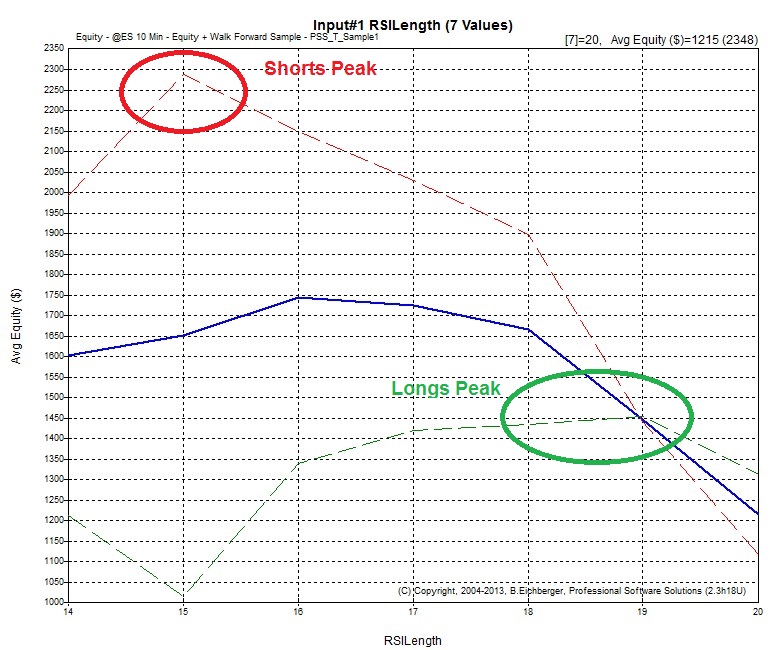
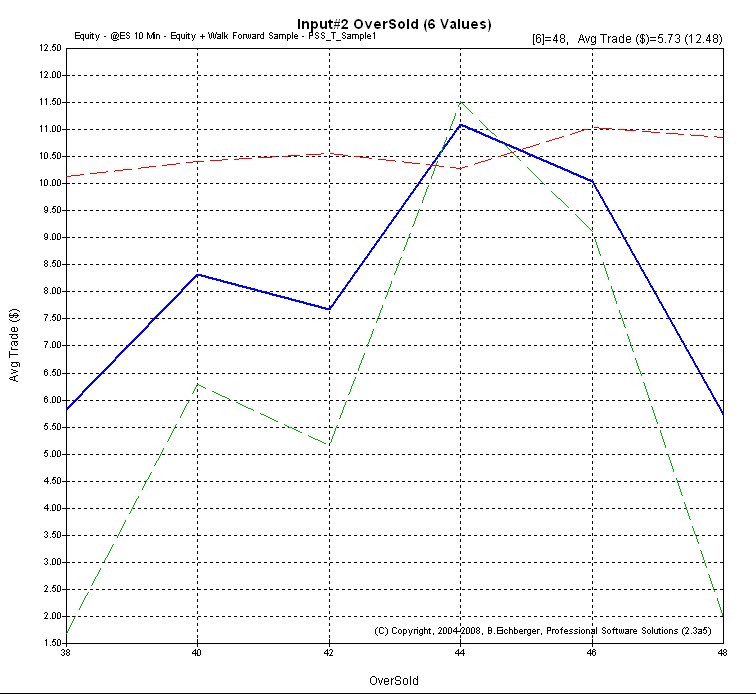
BTWFMgr allows you to detect the effect of each
parameter setting on the overall result.
This helps you to make sure your backtest is covering the optimal range, or if
you have to widen the testing range.
Below is an example of the sample RSI Strategy - showing the performance of the
RSI Length between 14 and 20 bars.
The red line shows the shorts only, green=longs only and thick blue=Avg long
& shorts.
Here we captured the optimum ranges of RSILength, showing peaks:
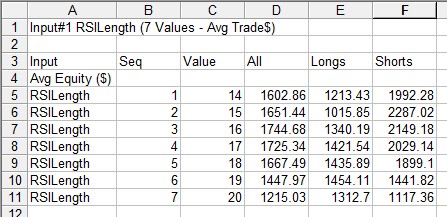
The data from shown in the Strategy Input Parameter Analysis chart - is automatically
exported,
in our example (WalkFwd) just clicking on the RSILength Input Parameter - creates:
Input_RSILength.csv
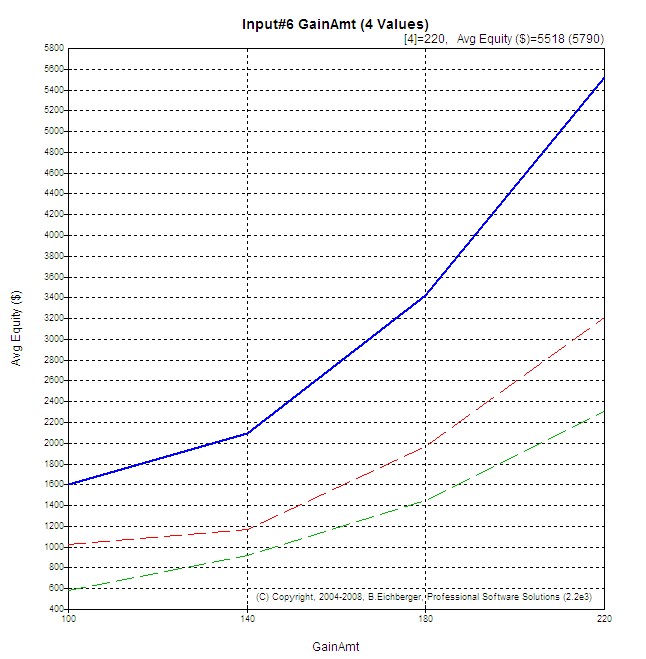
BIn the sample below (GainAmount), the optimum is at
higher than $200,
so increasing/shifting the testing range should give you better results.
Any trading strategy starts with the assumption/idea that entering at
its specific entry points will (on average) indicate an expected move of the market.
With BTWFMgr you can now VERIFY if this assumption is correct - here are some
examples how different strategies can perform:
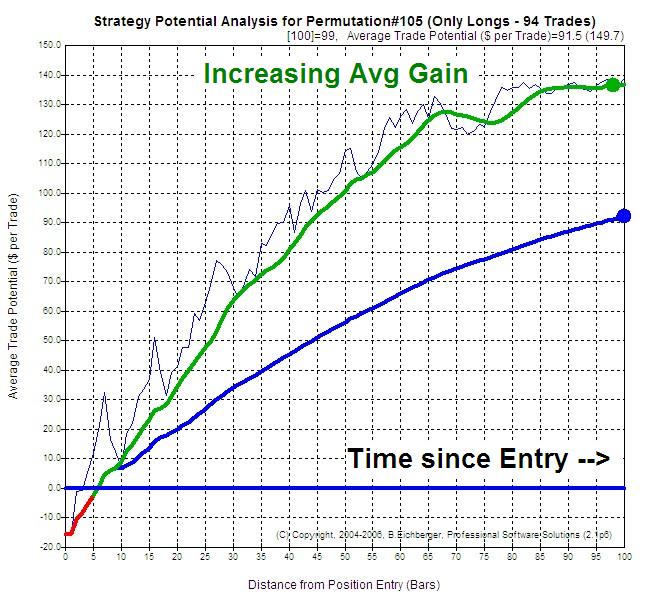
| Permanent Strategy Potential - best
scenario Here is an example on the best type of strategy potential: The market moves in the predicted direction and stays there. |
 |
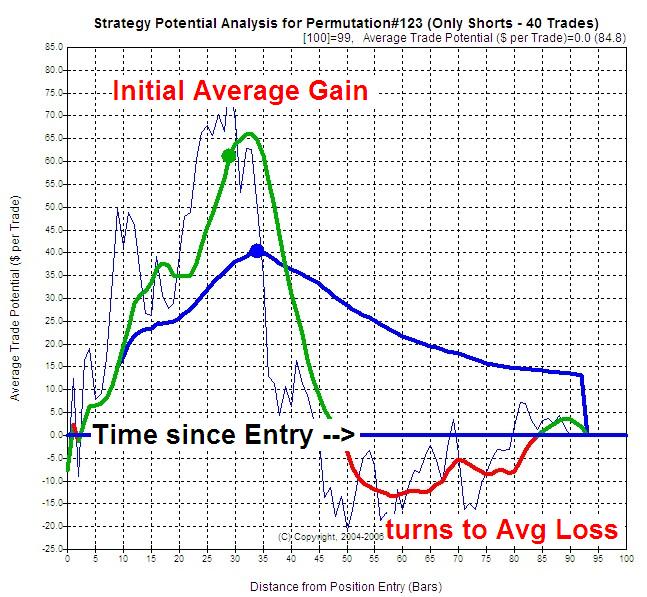
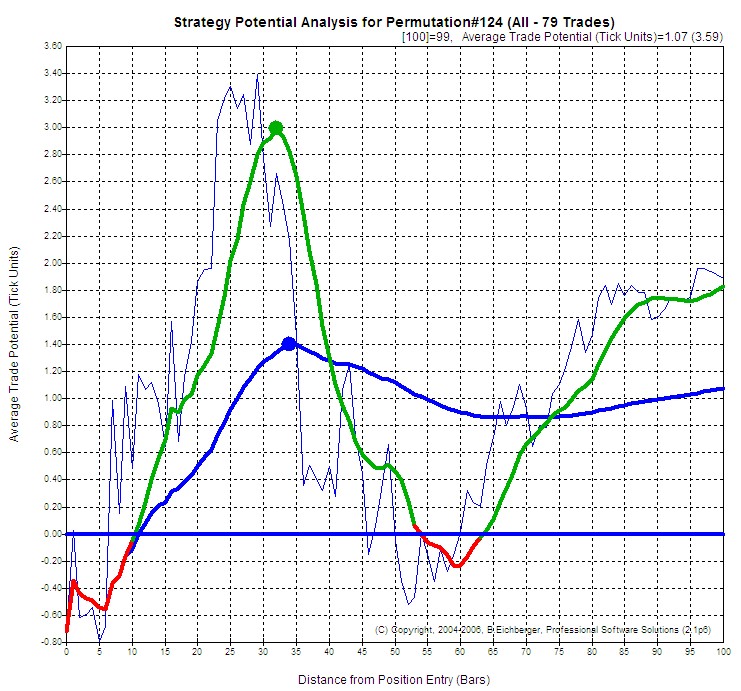
| Temporary Strategy Potential Here is an example on the second best type of strategy potential: The market moves initially in the predicted direction, but then moves against you. So you have to adjust the �Strategy Exit Logic� accordingly: tighten the trailing stop after around 60 bars and set the target in the $60 area. |
|
| No Strategy Potential Here is an example of a strategy which has NO strategy potential: The market moves from the very beginning against you. You can save yourself a lot of time (and money), because even the best �Strategy Exit Logic� cannot give you consistent profits, when the entries have � on average � no potential! Try a different market and/or timeframe � or improve/invert the strategy logic. |
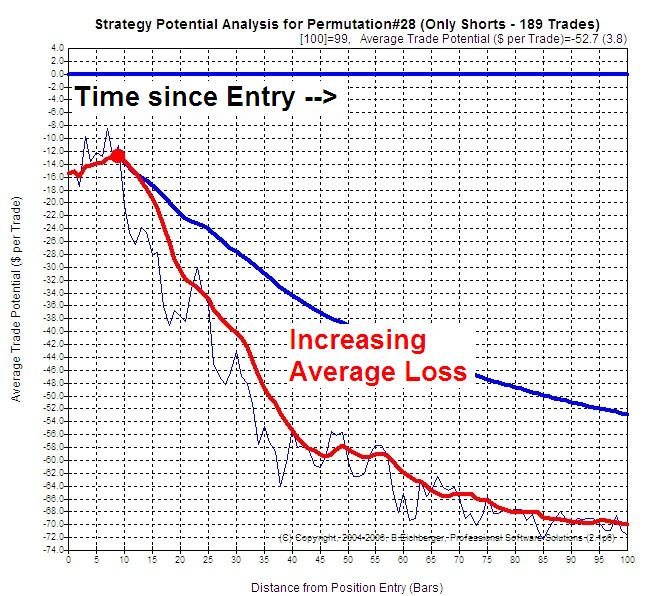 |
Here is a more detailed view of the "BTWFMgr Strategy Potential Chart"
If your strategy does not show a at least a temporay trading potential,
then ALL the other optimizations (even generic ones like Optimax etc)
and position exit variations will be in vain,
because the strategy does not have the essential behavior of predicting
(at
least in the short term) the market move after the entry!
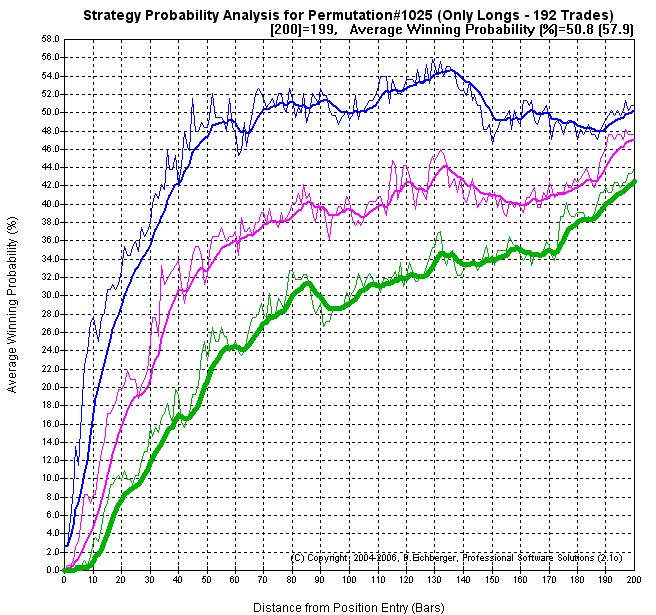
The
"probability map" function, allows you to detect the best probability
areas,
in the time based market response (Potential) analysis.
Below we can see an the best probability is reached after 75 bars,
for the three (customizable) target levels: $50(green),
$100(magenta),
$150(blue):
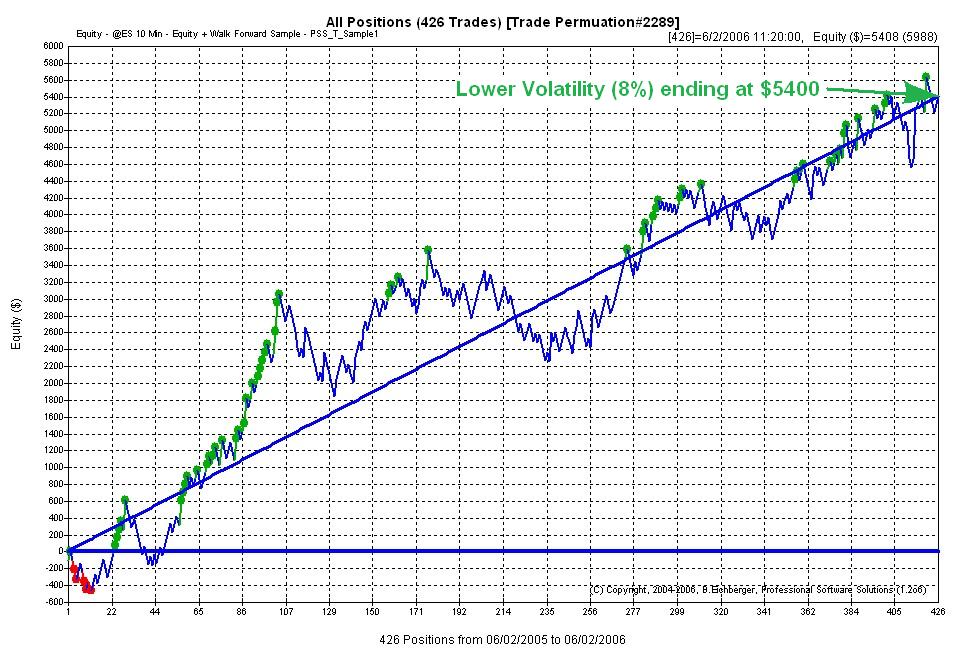
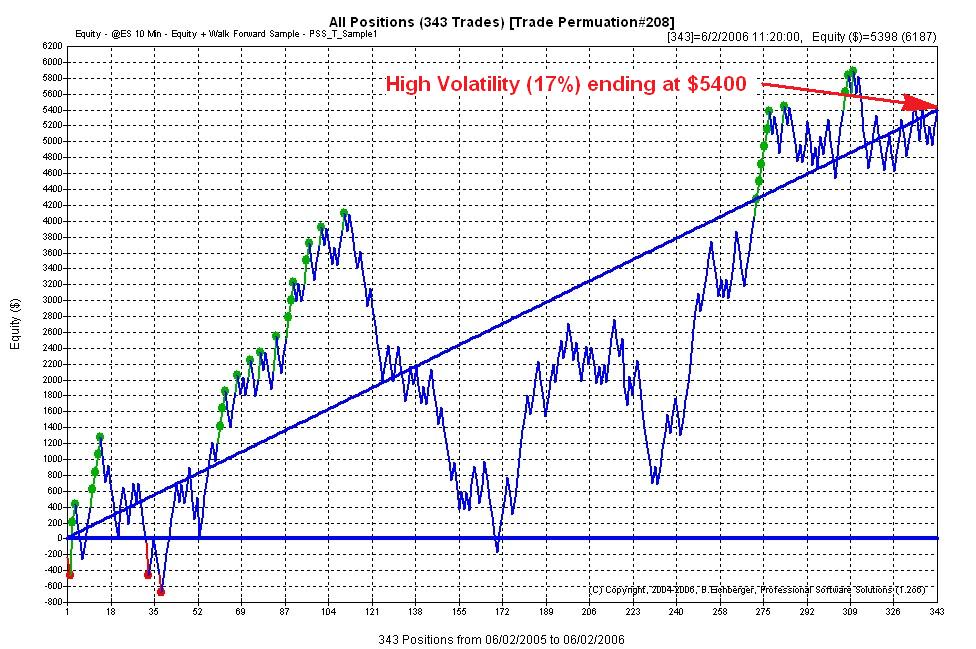
This function allows you identify which equity runs have
the lowest volatility.
In the examples below we have the same ending equity ($5400)
but very different swings around the straight ideal income line (0% volatility):
Relatively smooth Volatility (8.13%) (Permutation 2289
in WalkFwd example:
Nerve-wracking high Volatility (17.37%) (Permutation
208 in WalkFwd example):
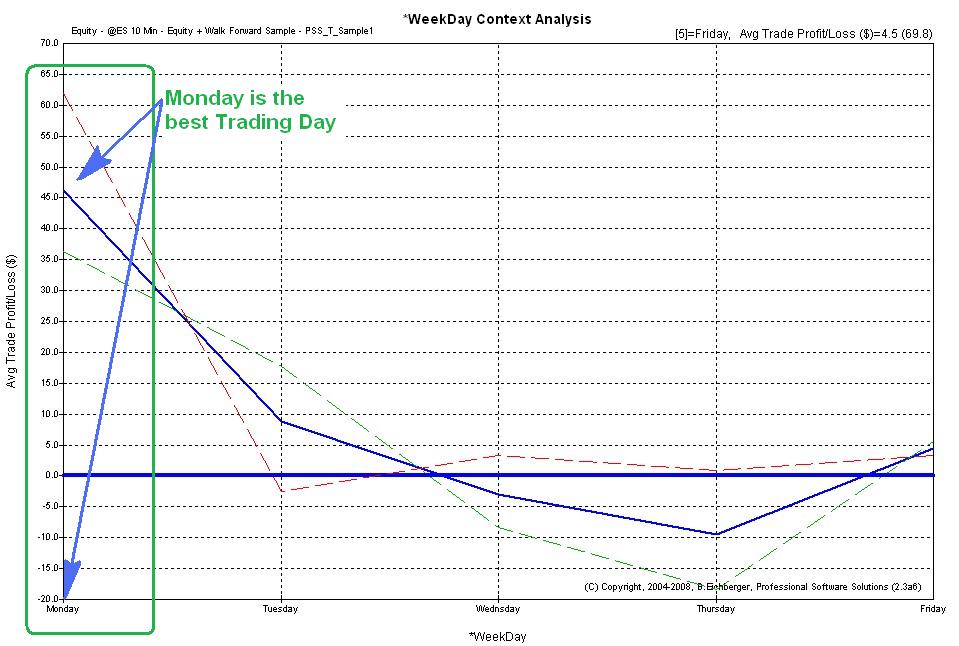
This function allows you identify the best weekday or intraday
time for all, long
or short trades.
In the sample below we can see that Monday is the best trading day:
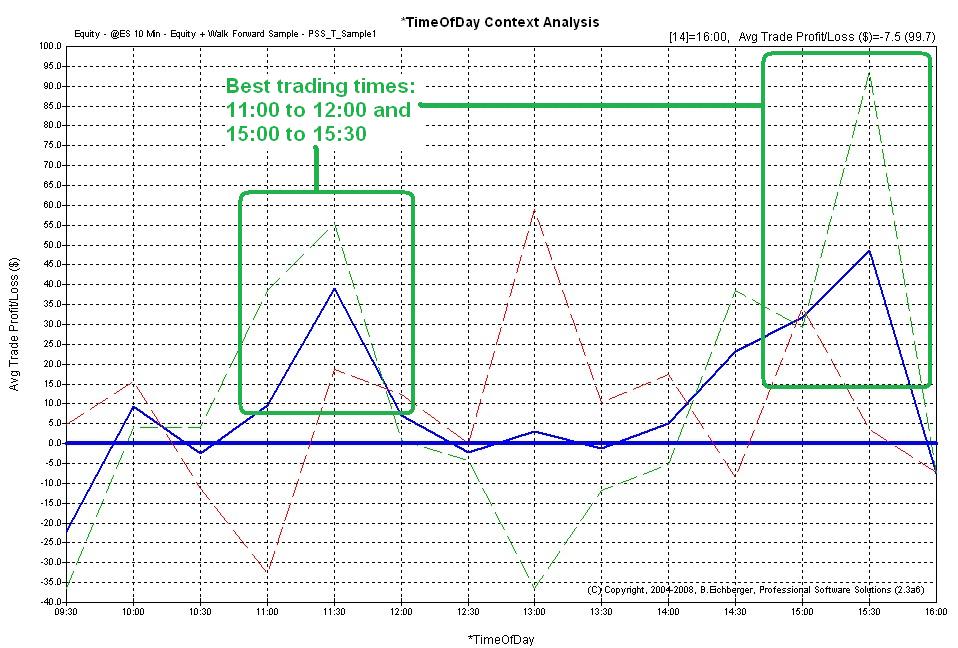
In the Equity Time Analysis sample below we can see that 11:000 to 12:00 and
15:00 to 15:30 are the best trading times:
(You can adjust the time interval in the configuration: Treeview/EquTimeLength
- the default is 30 minutes)
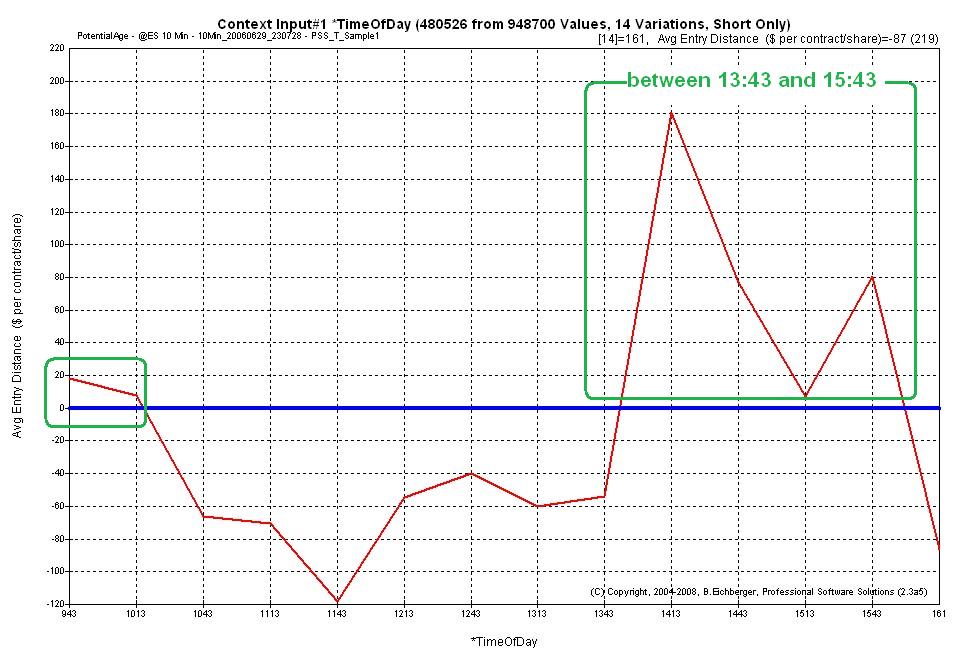
In the short side Potential Time Analysis sample below we can see that 13:43 to
15:43 are the best trading times:
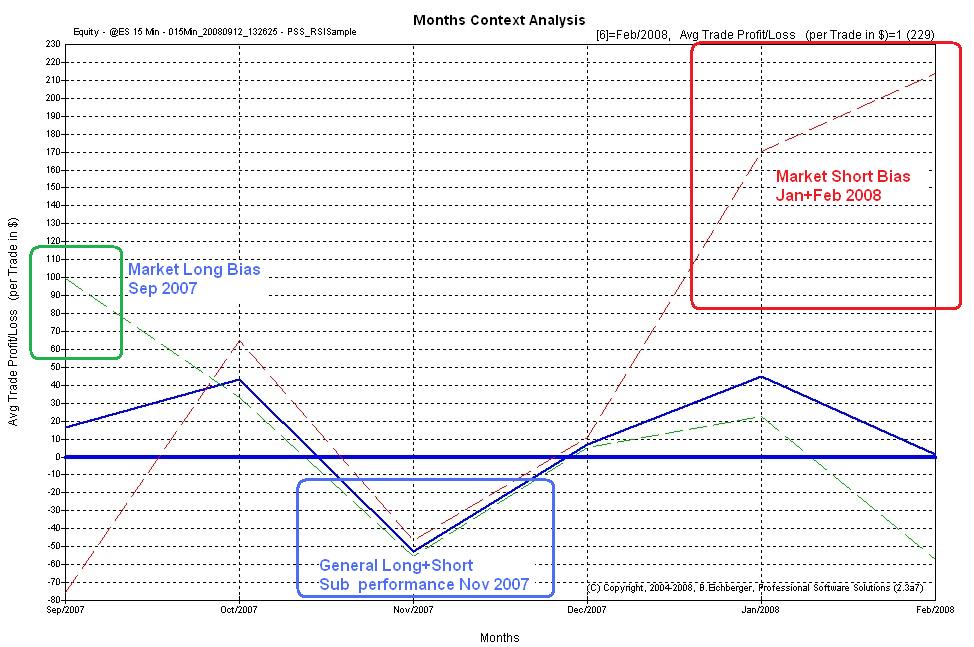
This function allows you to detect the general long or short bias
(if any) of your strategy
performance.
Also periods of strategy sub performances are shown:
You can also use a more detailed weekly market long/short bias analysis:
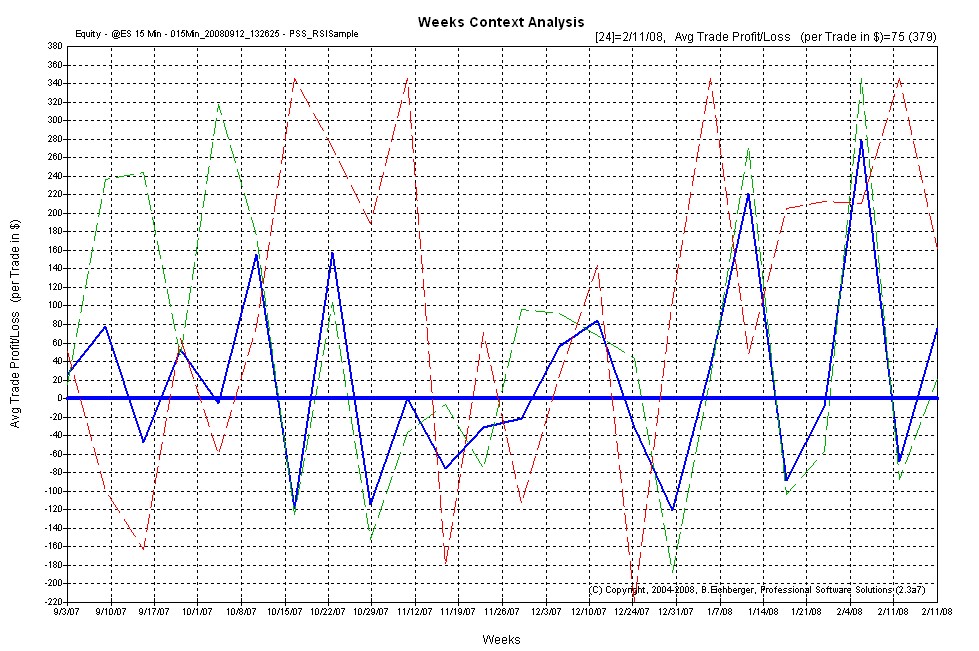
To activate this market bias analysis - just click on the respective branch once:
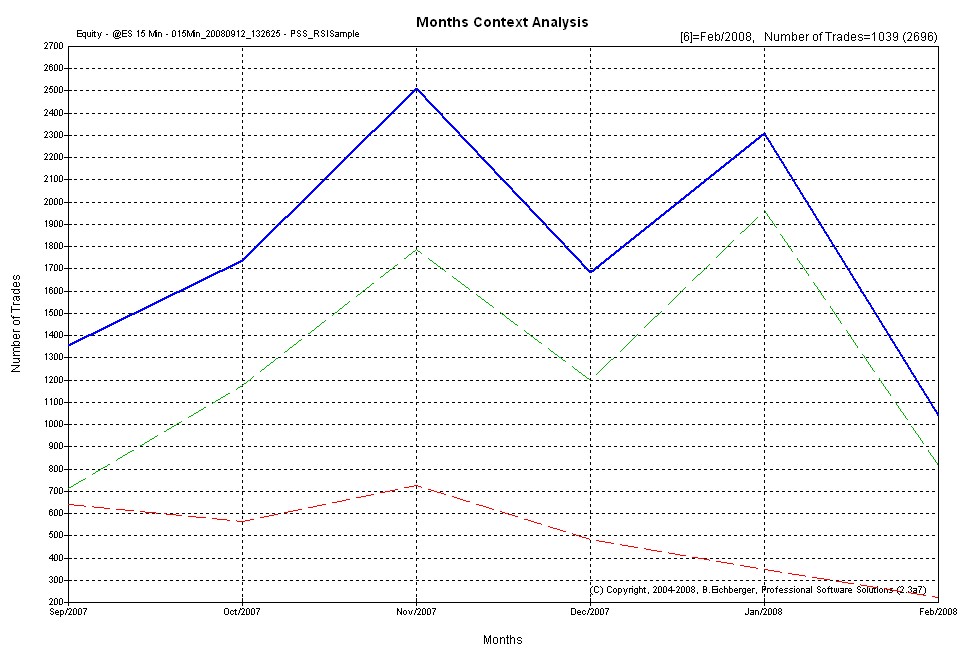
This function allows you to detect how frequently your strategy
is trading over time,
separated by long(green), short(red)
and total trades(blue):
You can also see the more detailed weekly (and even daily) frequency analysis:
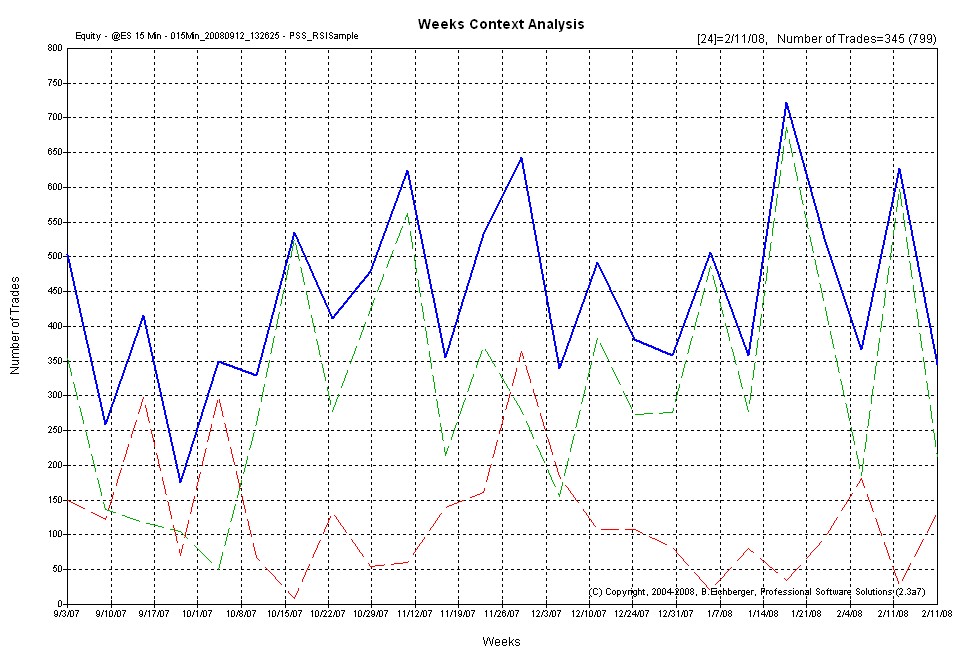
To activate this market bias analysis - just click on the respective branch
twice:
This function allows you export the permutation data and
then run your own advanced SQL queries and/or reports
to detect the best
results - click here
for an MDB example
(just enable the export by
setting Setting System/ExportTrdPer to YES and the next time you open an equity
result - all permutations will be exported)
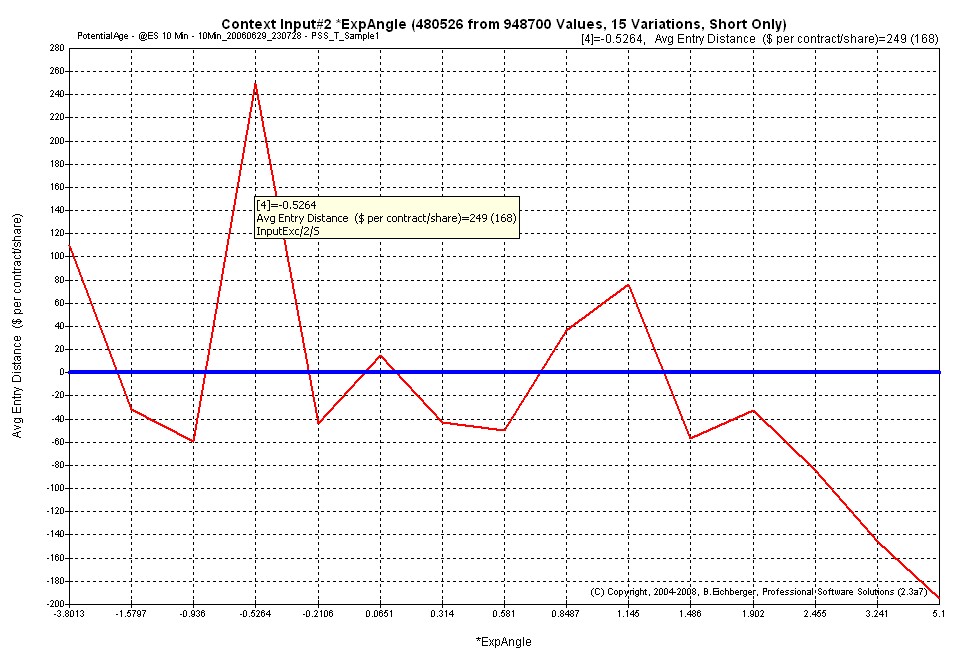
You can add any variable in Potential Mode to the
backtesting,
so you can detect any correlation between context variable range(s) and favorable potential results.
In the example below, we use the angle exponential average (see PSS_RSISample workspace),
detecting that slightly downward angle (around minus 0.5264) offer the best returns for
shorts(red):
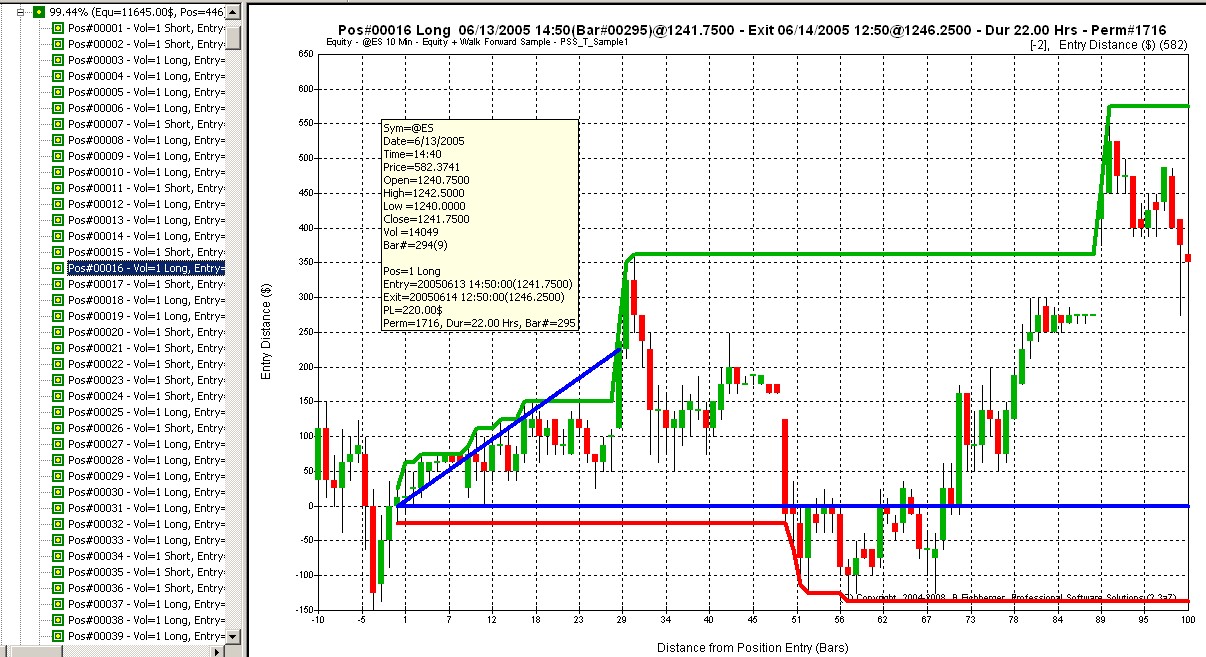
Provides you - with a mouse click - with the actual charts of each Position Entry, Exit and Risk/Reward excursion instantly, so you can evaluate also visually all entries and their performance - instead of using the cumbersome scrolling in the charts � in the example below we see:
a) the horizontal blue line (entry price)
b) maximum favorable excursion (green line)
c) maximum unfavorable excursion (red line)
d) Exit price (end of diagonal blue line):
Here are details about the Walk Forward Backtesting method
offered by BTWFMgr
After you have run several backtests for a strategy
across symbols and/or timeframes,
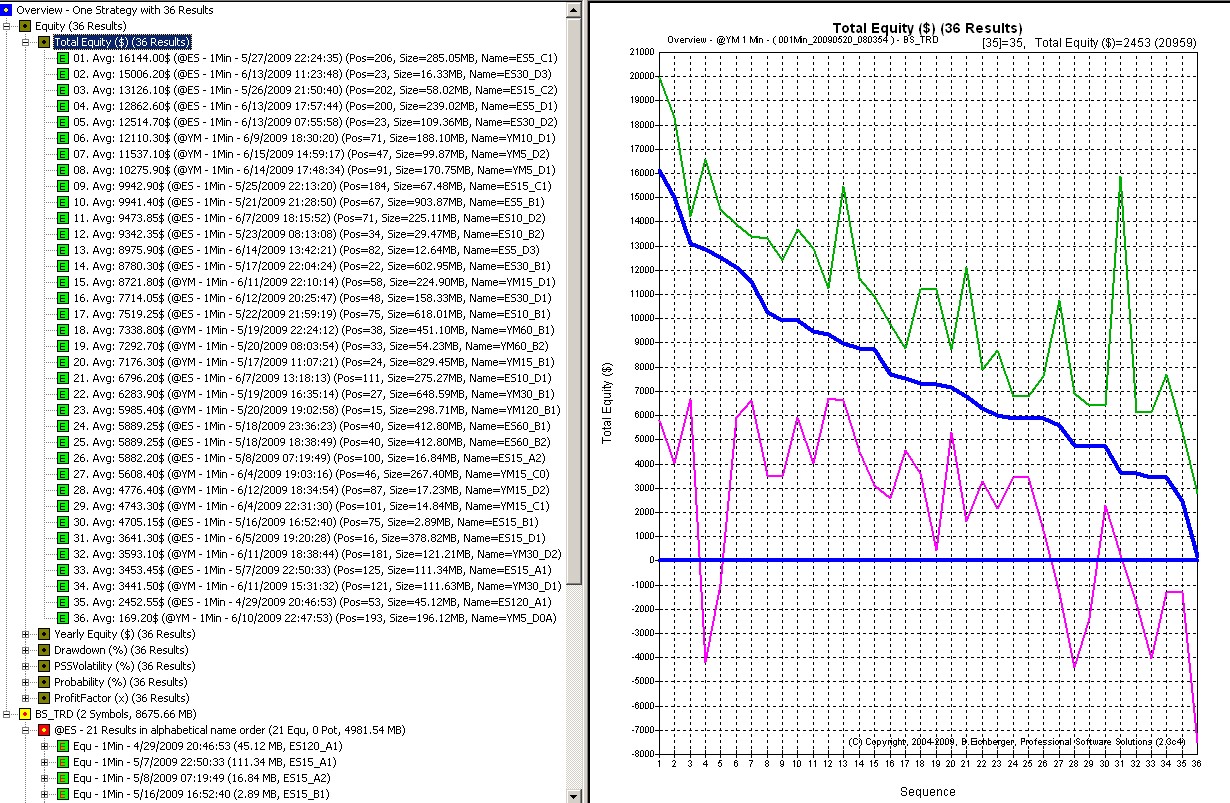
you can quickly detect the best performances in Equity or Potential Mode!
For all Equity Mode results you can rank by Equity, Annualized Equity, Drawdown,
Volatility%, Probablility% and ProfitFactor:
(the blue line shows the average probability of the top 10 results,
the thin green the best and the blue the average of the top 100 results)
You can also apply result filter etc - more details here
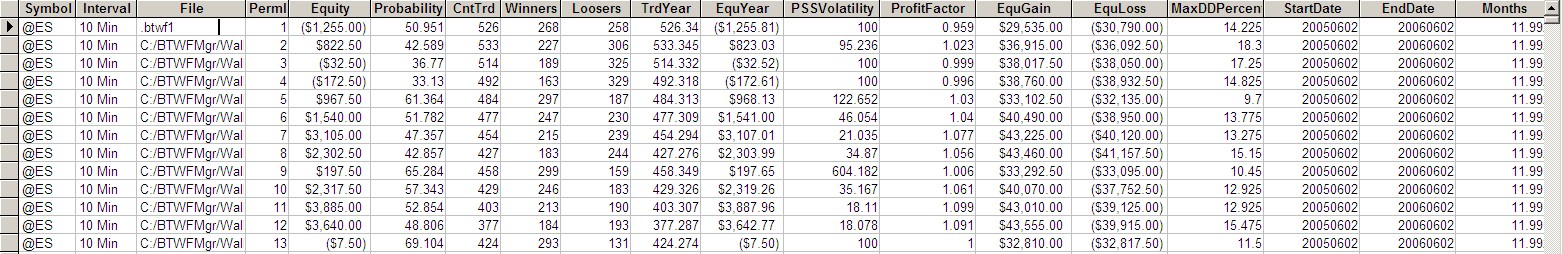
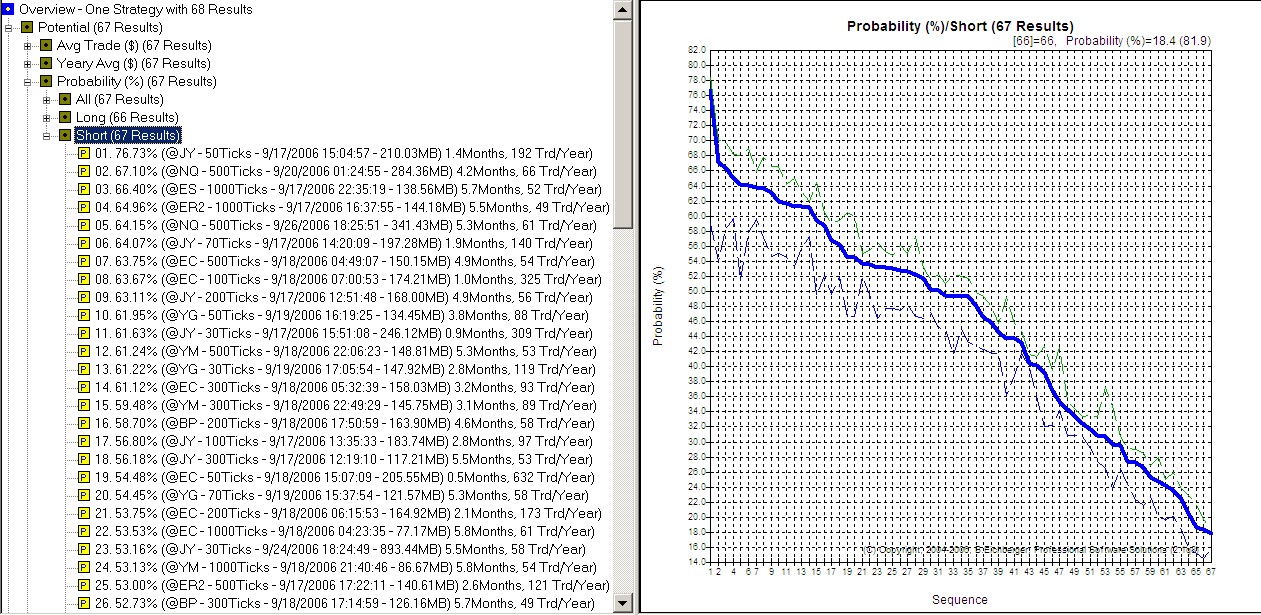
For all Potential Mode results you can rank by Avg Trade$, Yearly Avg$, Probability%,
etc.
calculated separately by long/short or long+short/merged trading,
below is a screen shot with the best potential probability results for shorts:
(the blue line shows the average probability of the top 10 results,
the thin green the best and the blue the average of the top 100 results)
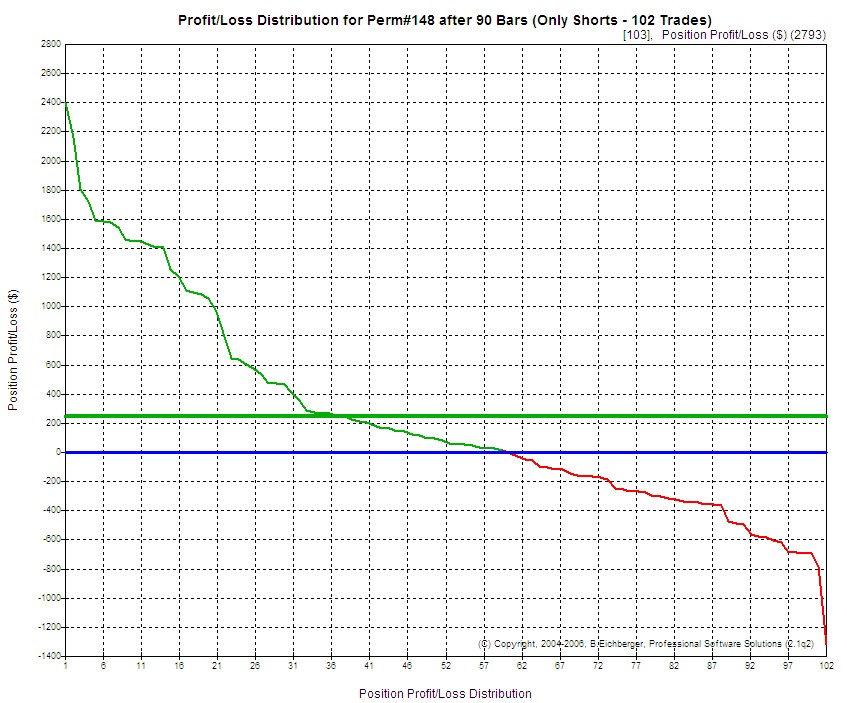
The "Profit/Loss Distribution Analysis" tool contained in the
BTWFMgr,
allows you to detect the best and worst trades at the specified distance after
the entry.
Below is an example showing the profit/loss distribution of the 102 positions.
The average is $246 (horiz. green line) and we can see 59 winners (green)
against 43 losers (red)
with the best profit of 2405.00$ and the worst loss at -1315.00$.
This analysis will also produce a detailed list of all trades:
Profit/Loss Distribution for Perm#148 after 90 Bars (Only Shorts - 102 Trades)
Average Profit/Loss: 246.77$
Average Duration : 3.88 Hrs (90 Bars)
Probability : 57.84 Percent (59 Winners, 43 Loosers)
1. PL= 2405.00$ - 07/20/2006 08:40(Bar#06790)@708.6000 - Exit 07/20/2006 15:14@684.4000 - Dur 6.57 Hrs
2. PL= 2165.00$ - 05/23/2006 09:40(Bar#03577)@735.0000 - Exit 05/23/2006 15:14@713.2000 - Dur 5.57 Hrs
3. PL= 1805.00$ - 06/05/2006 10:31(Bar#04213)@739.9000 - Exit 06/05/2006 15:14@721.7000 - Dur 4.72 Hrs
...
100. PL= -695.00$ - 06/15/2006 09:53(Bar#05084)@700.5000 - Exit 06/15/2006 15:14@707.3000 - Dur 5.35 Hrs
101. PL= -785.00$ - 07/03/2006 08:40(Bar#05951)@728.8000 - Exit 07/03/2006 12:14@736.5000 - Dur 3.57 Hrs
102. PL= -1315.00$- 06/08/2006 12:54(Bar#04558)@699.3000 - Exit 06/08/2006 15:14@712.3000 - Dur 2.33 Hrs
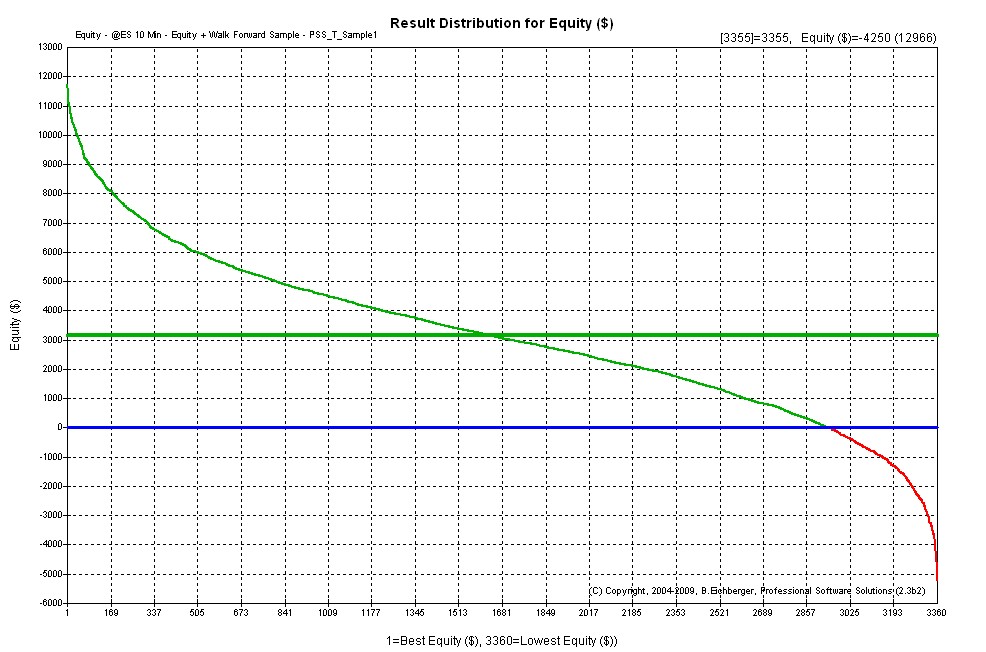
This function allows you to review ALL your
backtesting permutation results,
checking that most results are acceptable - and not just a few unusual outliers.
Just click on the "Sorted by Equity" or "Sorted by Drawdown"
etc" item in the Equity treeview,
or click on the toolbar icon ![]() or from the Menu/Functions/Result Distribution.
or from the Menu/Functions/Result Distribution.
The results are always sorted by the selected criteria across all trading
permutations:
Below is an example of the Equity distribution, showing the sorted equities of
all 3360 permutations with the Average around $3100:
This function allows you to view the current Walk Forward periods across the entire
trading range with the positions being traded in the current permutation.
Just click twice on any trading permutation (green squares) and BTWFMgr will
show you the Walk Forward periods across the entire
trading range.
Below is a monthly Iin(blue)/OutSample(green) walk forward (custom) period
setup.:
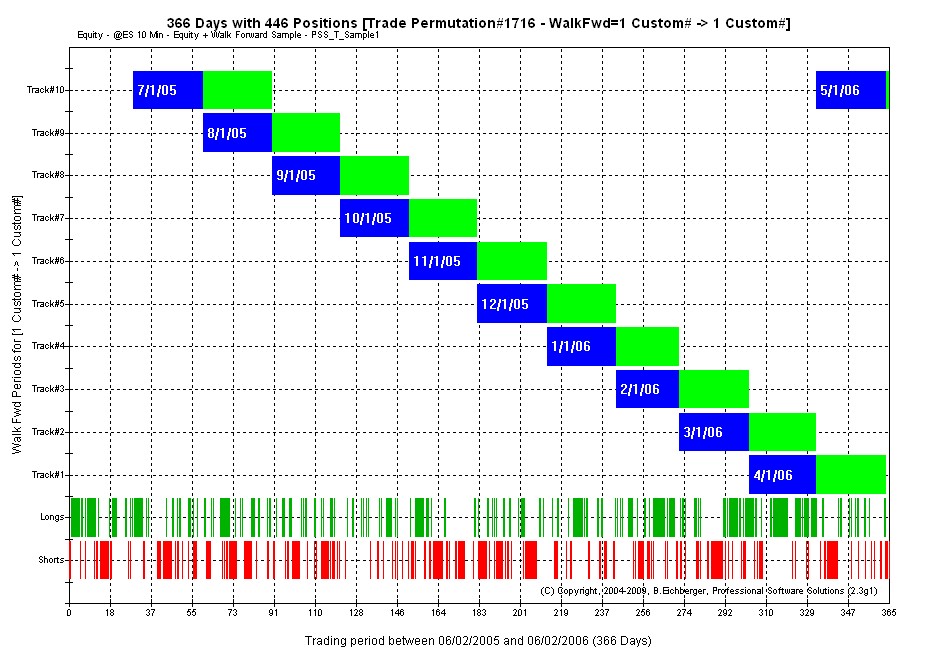
The blue areas show in "In-Sample" periods with the green
"Out-Of-Sample" periods.
At the bottom you see the long and short trades.
Just hover the mouse of the trades or In/OutSamples areas at view more details
in the tooltip wiondow.
You can also right click on the trade permutation and select "Show Positions+Walk Forward Periods".
RISK DISCLOSURE:
Futures and forex trading contains substantial risk and is not for every investor.
An investor could potentially lose all or more than the initial investment.
Risk capital is money that can be lost without jeopardizing one's financial security or life style.
Only risk capital should be used for trading and only those with sufficient risk capital should consider trading.
Past performance is not necessarily indicative of future results.
HYPOTHETICAL PERFORMANCE DISCLAIMER:
Hypothetical performance results have many inherent limitations, some of which are described below.
No representation is being made that any account will or is likely to achieve profits or losses similar to those shown;
in fact, there are frequently sharp differences between hypothetical performance results and
the actual results subsequently achieved by any particular trading program.
One of the limitations of hypothetical performance results is that they are generally prepared with the benefit of hindsight.
In addition, hypothetical trading does not involve financial risk, and no hypothetical trading record
can completely account for the impact of financial risk of actual trading.
For example, the ability to withstand losses or to adhere to a particular trading program in spite of trading losses are
material points which can also adversely affect actual trading results. There are numerous other factors related to
the markets in general or to the implementation of any specific trading program which cannot be fully accounted for in the preparation
of hypothetical performance results and all which can adversely affect trading results.
ADDITIONAL DISCLAIMER:
Professional Software Solutions(PSS), also known as PSS assumes no responsibility for your trading results.
Past performance does not guarantee future performance and Professional Software Solutions does not make any performance representations or guarantees.
Any chart or trading demonstration produced by Professional Software Solutions representing trades and using any systems/methods on the www.ProfSoftware.com website
or in any advertisement, seminar, brochure, magazine or online demonstrations are to be considered hypothetical trades for educational purposes only.
No trading system can guarantee profits. Hypothetical trading results can be unreliable.
Testimonials Disclosure:
Testimonials appearing on this website may not be representative of other clients or customers and is not a guarantee of future performance or success.
© Copyright 2004-2023, Burkhard Eichberger, Professional Software Solutions - All Rights Reserved Worldwide.