time period, sensitivity, recent bias etc
Example:
The new "Universal Trend Detection System (UNITRDES)" offers:
Try UNITRES for free for 14
days on your computer -
For more details: Manual
Page or PDF
Below is a Screen Sample
showing the continuous trend color in the chart bars and the trend strength
indicator:
What is a Trend?
Trend Trading Sample Charts:
(After you have installed UNITRES - you can download
any of the samples below - just click
any header line)
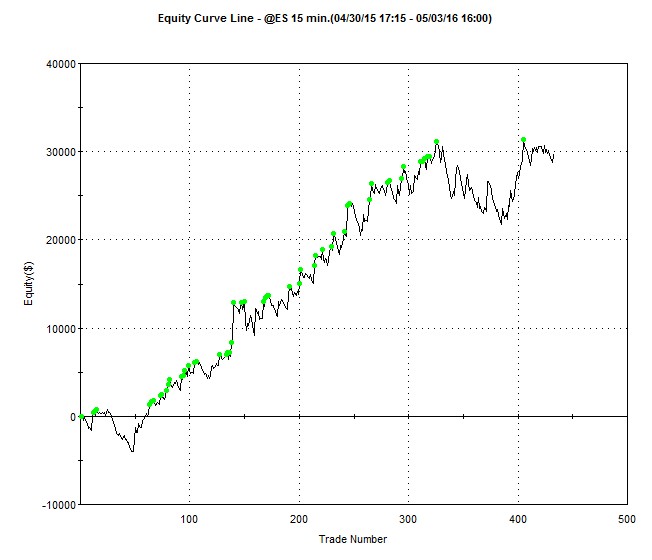
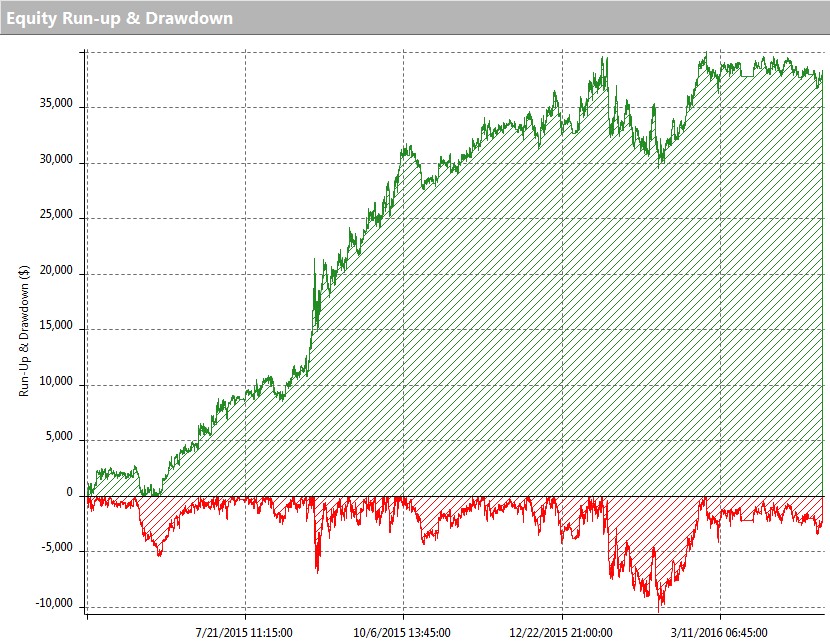
ES SP500 15Min Intraday Sample (ES15)
PerformanceReport(ES15.mht)
Loads 23,590 bars from May 1, 2015 to May
2, 2016:
Parameter: Scope=30, Smooth=1, Recent=--10, Step=1200, CloseFac=100, Entry=3,
Exit=2, Tar=0:
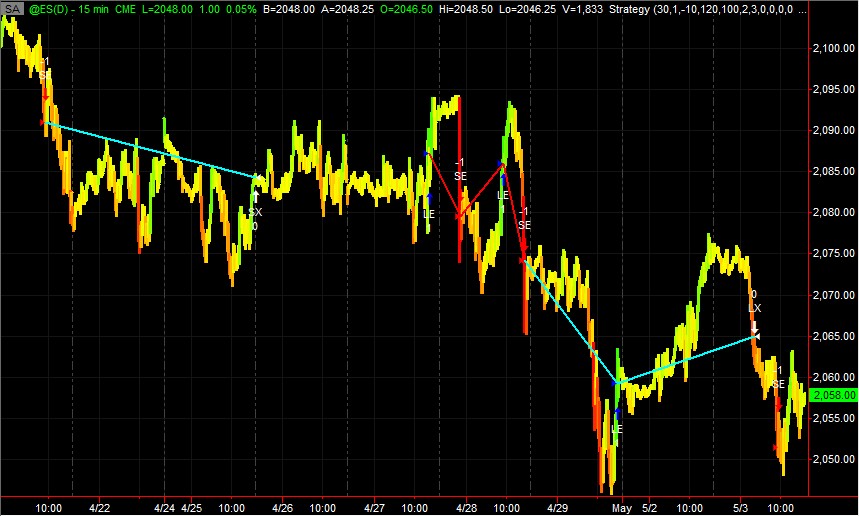
Performance (TradeStation and MultiCharts):
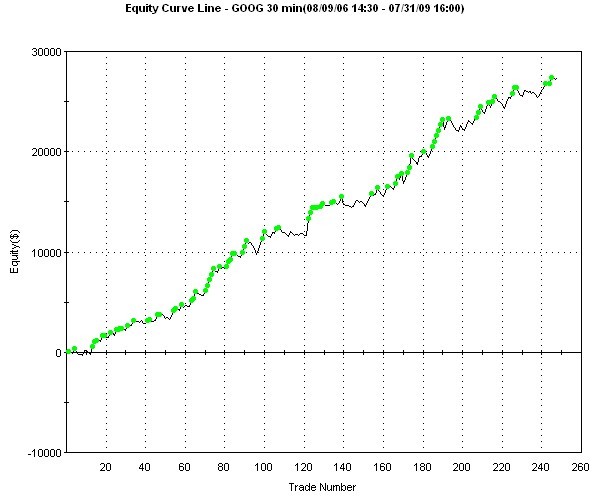
GOOG Stock 15Min
Intraday Sample (GOOG_I30) PerformanceReport(GOOG30.mht)
Loads 12,001 bars from July 31st, 2009:
Parameter: Scope=45, Smooth=3, Recent=-8, Step=50, CloseFac=100, Entry=3, Exit=3, Tar=550:
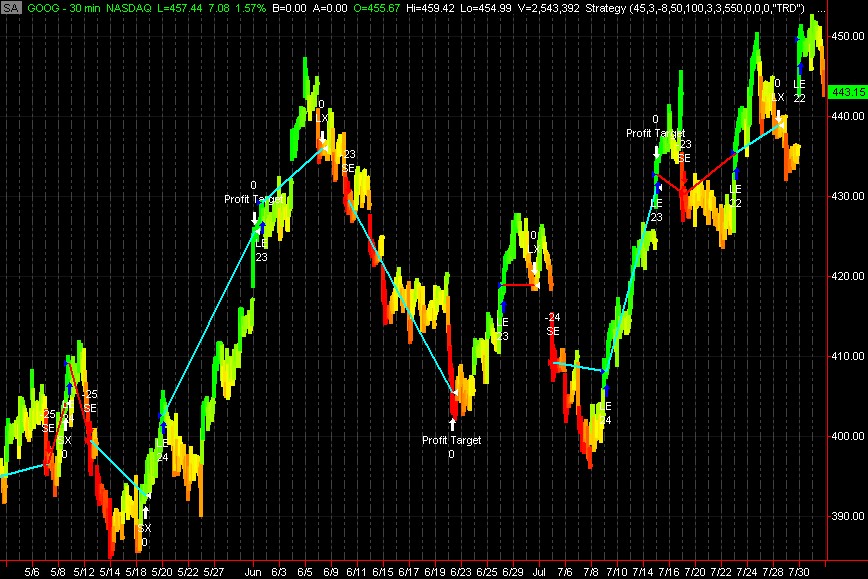
Performance:
USO ETF Daily Sample1 (USO_D1)
In this example UNITRDES tracks nicely the
major long term swings in the Oil price (USO) over the last 2.5 years
and gained 178% in 2 long and 2 short trades:
(Parameter: Scope=40, Smooth=1, Recent=2, Step=80, CloseFac=100, Entry=2, Exit=3, Tar=0)
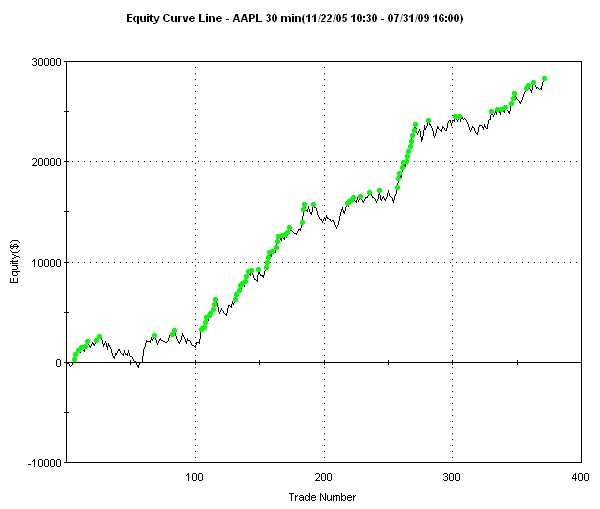
AAPL Stock
30Min Intraday Sample (AAPL_I30)
PerformanceReport(AAPL30.mht)
Loads 12,001 bars from July 31st, 2009:
Parameter: Scope=160, Smooth=1, Recent=-10, Step=60, CloseFac=100, Entry=3, Exit=2, Tar=500
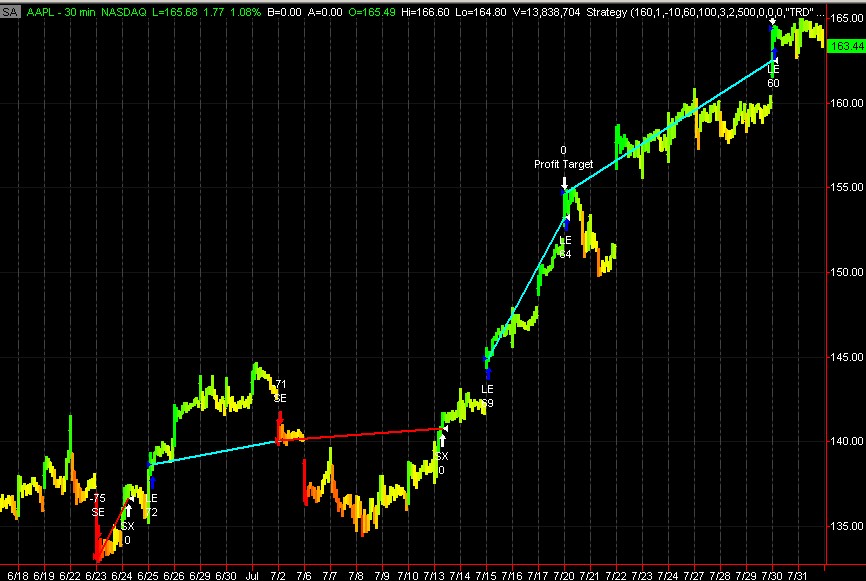
Performance:
SPY ETF Daily Sample
(SPY_D)
Loads Oct 2003 to July, 2009 and trades on major trend changes:
Parameter: Scope=200, Smooth=1, Recent=10, Step=115, CloseFac=100, Entry=2, Exit=2, Tar=0
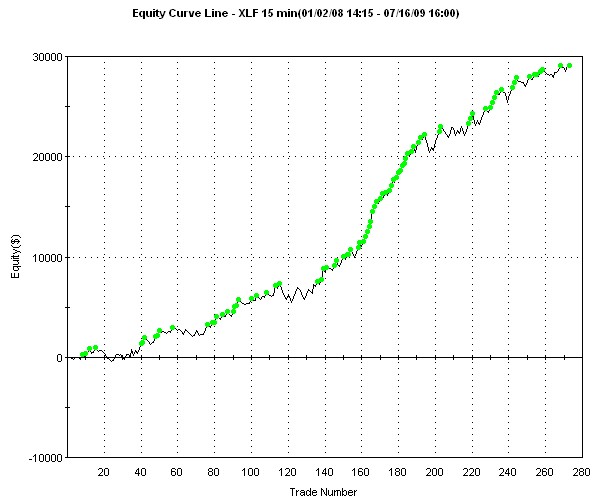
XLF ETF 15Min Intraday Sample
(XLF_I15)
Loads 10,001 bars from July 16th, 2009:
Parameter: Scope=30, Smooth=3, Recent=2, Step=40, CloseFac=100, Entry=2, Exit=2, Tar=500
Performance:
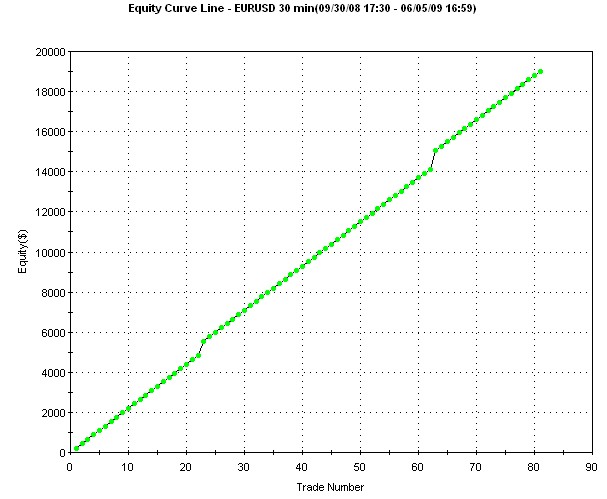
EURO FOREX 30Min Intraday Sample
(EUR_I30)
Loads Oct 2008 to June 6th, 2009:
Parameter: Scope=100, Smooth=1, Recent=-10, Step=120, CloseFac=100, Entry=3, Exit=8, Tar=220
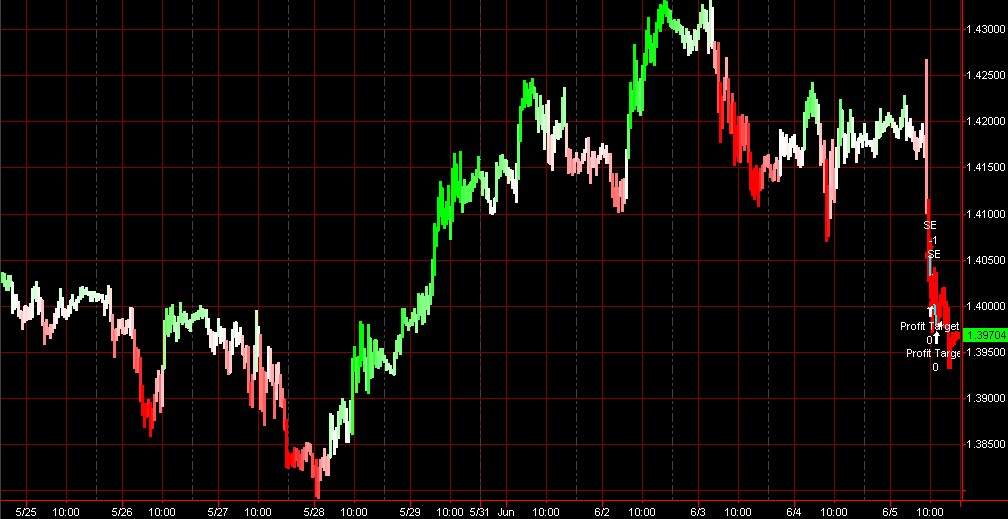
Performance:
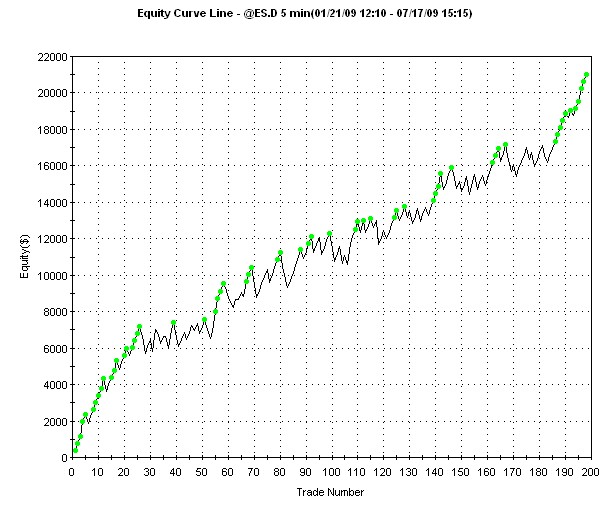
ES SP500 eMini Futures 5Minute Intraday Sample
Loads 10,000 bars from July 18th, 2009:
Parameter: Scope=100, Smooth=3, Recent=-10, Step=80, CloseFac=200, Entry=2, Exit=6, Tar=400
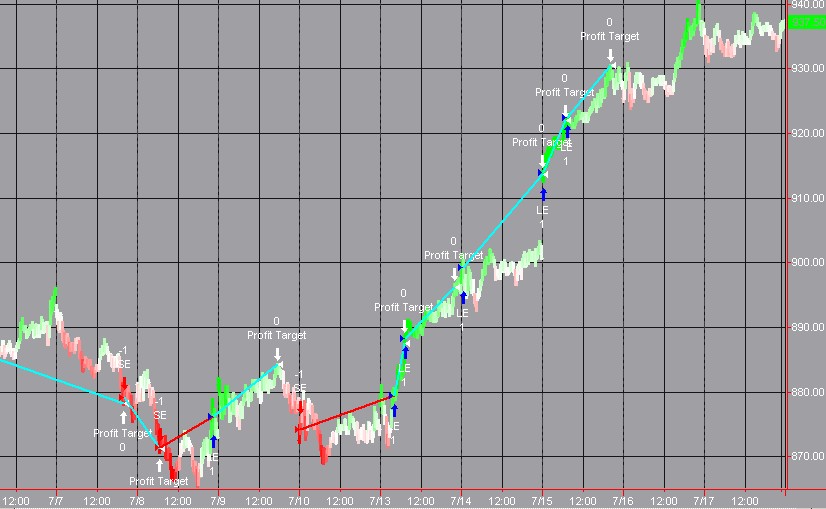
Performance:
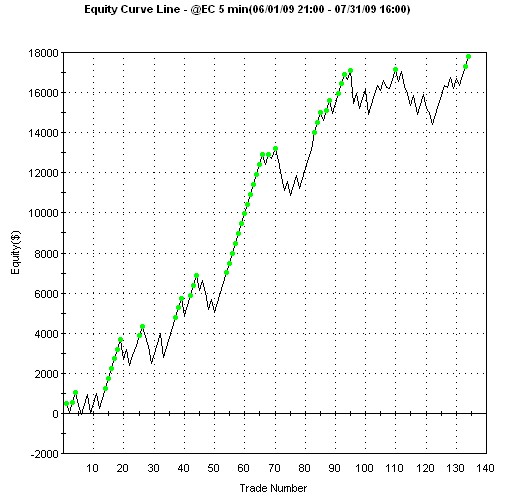
Euro
Futures 5Minute Intraday Sample (EC_I5)
Loads 12,001 bars from July 31st, 2009:
Parameter: Scope=60, Smooth=1, Recent=-10, Step=140, CloseFac=100, Entry=2, Exit=3, Tar=500
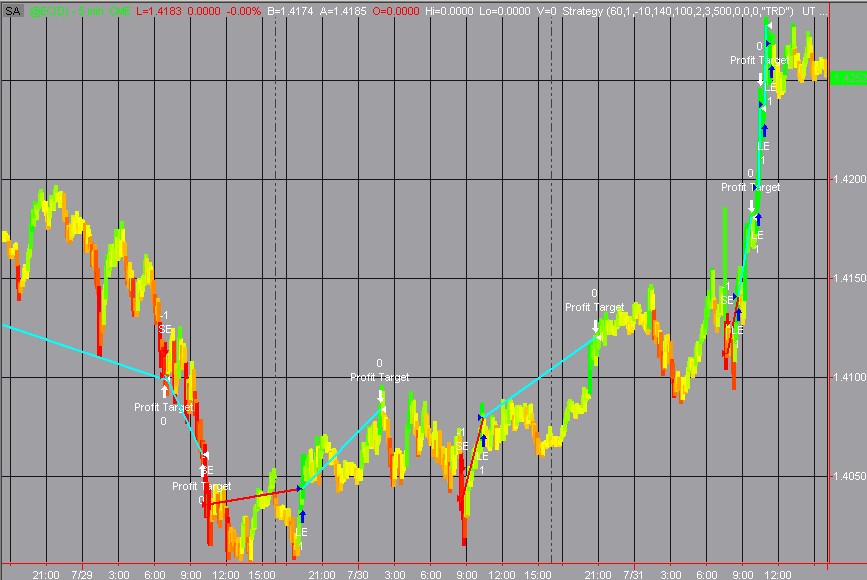
Performance:
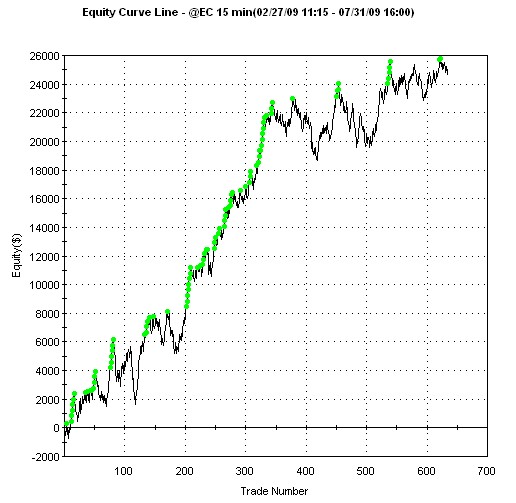
Euro Futures
15Minute Intraday Sample (EC_I15)
Loads 10,001 bars from July 31st, 2009:
Parameter: Scope=60, Smooth=3, Recent=-6, Step=24, CloseFac=100, Entry=2, Exit=3, Tar=400
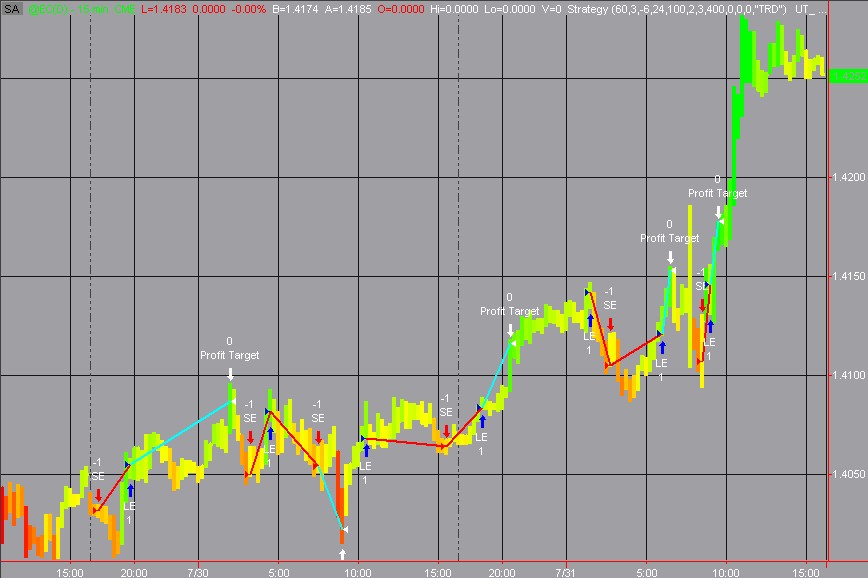
Performance:
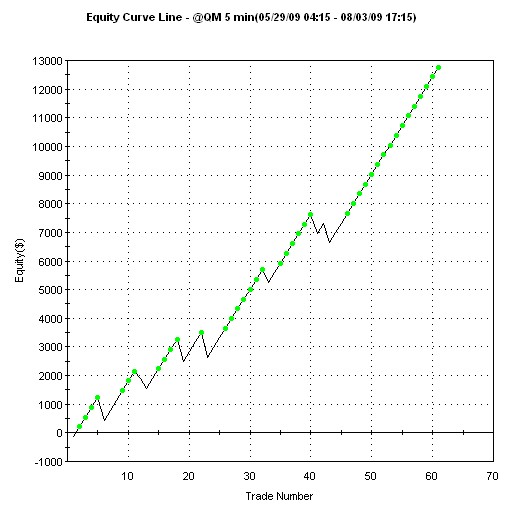
Crude
Oil Mini Futures 5Minute Intraday Sample (QM_I5)
Loads 12,001 bars from Aug 2nd, 2009:
Parameter: Scope=40, Smooth=1, Recent=-9, Step=160, CloseFac=100, Entry=3, Exit=4, Tar=350
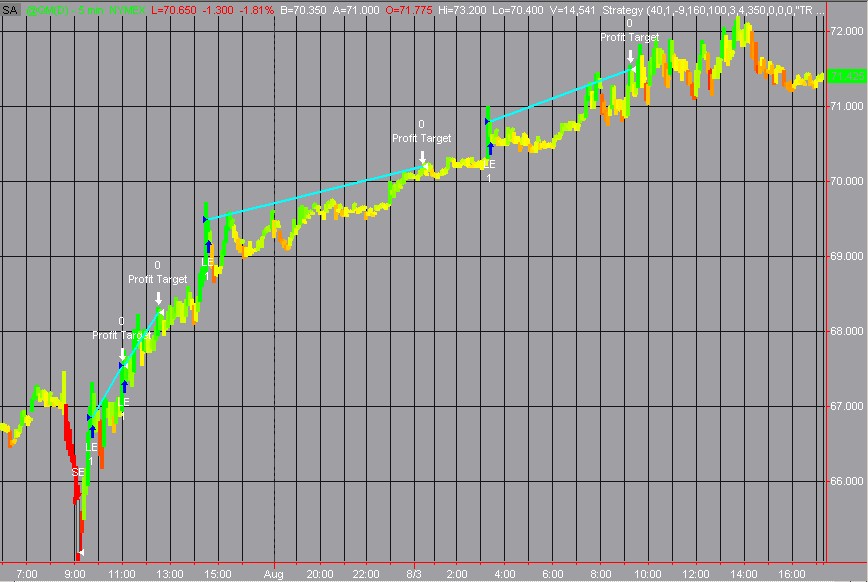
Performance:
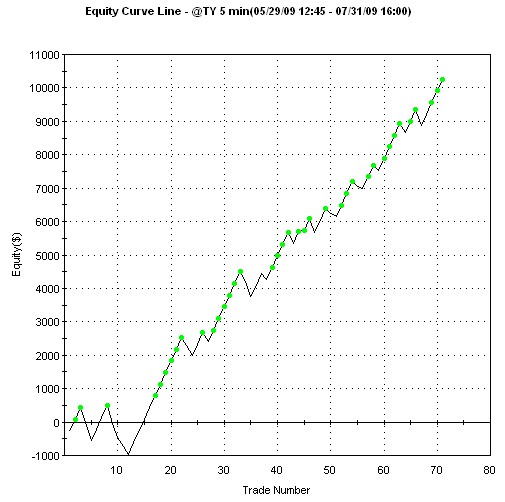
10 Year Treasury Futures 5Minute Intraday
Sample (TY_I5)
Loads 12,001 bars from July 31st, 2009:
Parameter: Scope=100, Smooth=1, Recent=-11, Step=140, CloseFac=100, Entry=3, Exit=3, Tar=350
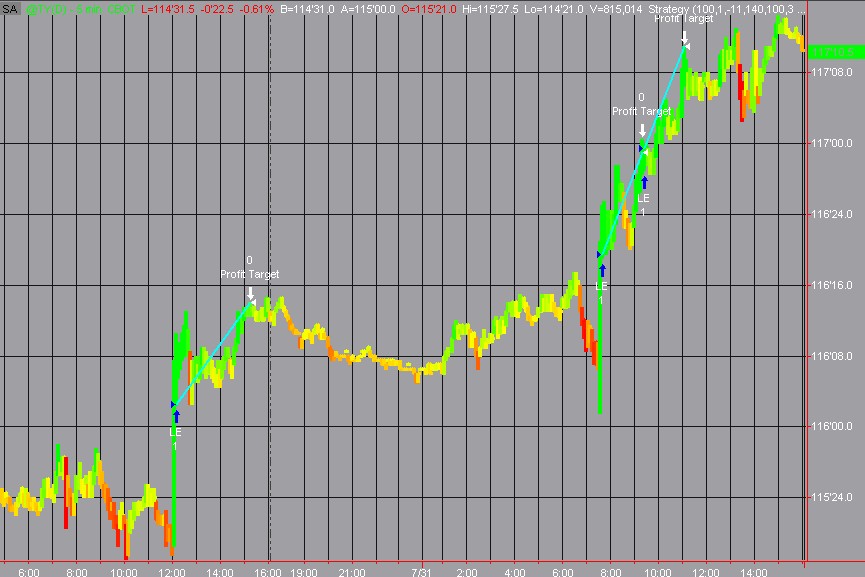
Performance:
USO ETF Daily Sample2 (USO_D2)
Here we adjusted the parameter to trade less frequent -
over the last 4 years from July, 2009, trading only major trend changes:
Parameter: Scope=120, Smooth=2, Recent=9, Step=40, CloseFac=100, Entry=2, Exit=2, Tar=0
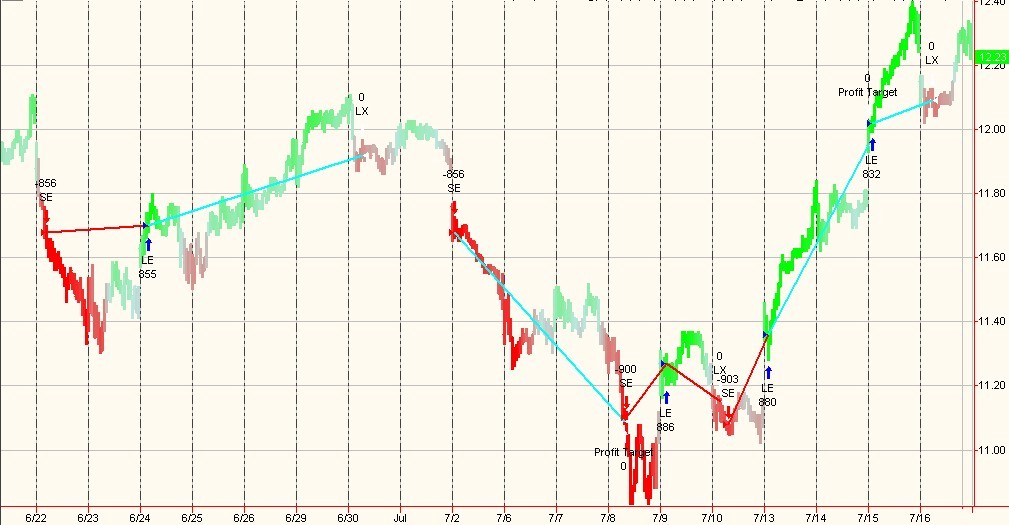
Smart continuous
Trend Color Display in the Charts
UNITRDES displays the current
trend point as a specific color point within the continuous color spectrum.
You choose the three colors in the UT_Bars indicator - defining the Spectrum:
Examples below:
| Up Middle Down |
Green Yellow Red |
Green White Red |
Green 189,230,225 Red |
Green Black Red |
Green Blue Red |
Blue 128,128,255 White |
White Grey Black |
Olive Orange Magenta |
 |
 |
 |
 |
 |
 |
 |
 |
 |
You can specify colors by name (Red. Green etc)
or via the RGB value:
Example: Light Blue is RGB(128,128,255) or Grey is RGB(128,128,128)
Use UNITRDES in any market and
timeframe
UNITRDES can be use with any
market (see samples):
- Stocks
- Futures
- ETF's
- FOREX
- etc
UNITRDES can also be in any timeframe (see samples):
- Daily
- Intrabar (X Minutes)
- Ticks
- Volume bars
UNITRDES open source - integrate into your Strategy/Indicator
The UNITRDES EasyLanguage source code is available - so
can integrate UNITRDES into your strategy and/or indicators.
|
Strategy: UTC_TRD.txt |
| PaintColorBar: UTC_Bars.txt |
| Indicator: UTC_Trend.txt |
What is a Trend?
Here is the definition from Wikipedia - http://en.wikipedia.org/wiki/Market_trends
"Market trends are described as sustained movements in market prices over a period of
time."
The “Universal Trend Detection (UNITRDES)” allows you to detect a trend in real-time.
You can customize the “period of time” with the UTScope parameter - as the number of bars to be used.
You can customize also the detection of the “sustained movement” with the UTStep parameter – see
below and
the color scheme being used.
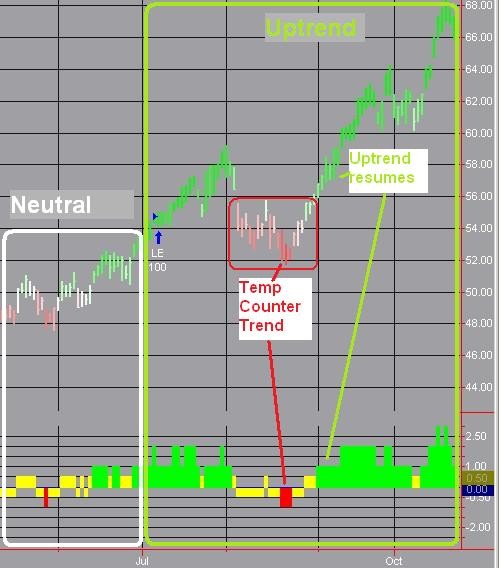
A trend movement is rarely completely smooth and unchallenged.
Usually the trend will experience a secondary counter trend, before it resumes again.
Finally the trend will have exhausted itself and either transition into a neutral sideways period
or a new counter trend will start. As you can see a “trend” is not a very precise mathematical formula,
that’s why we give you several parameters to adjust the trend detection to your preverences – see below!
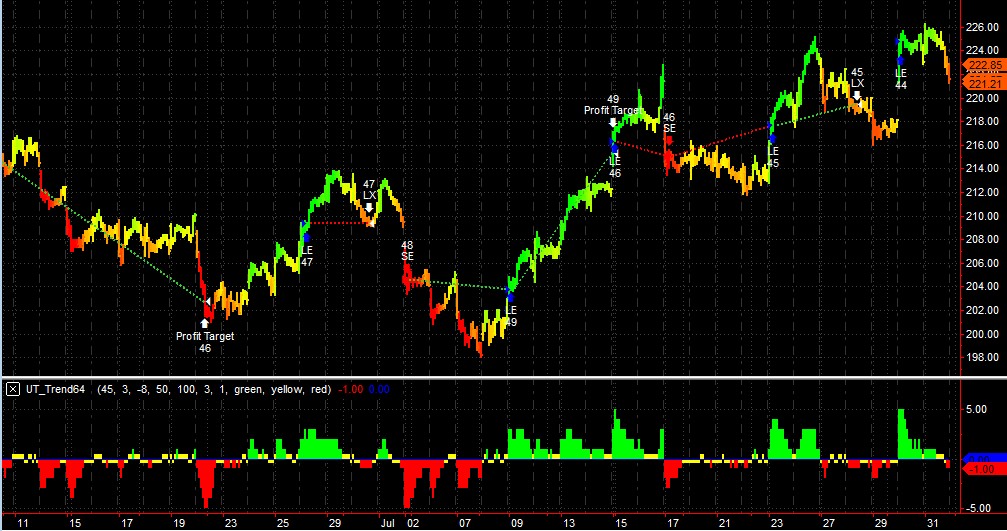
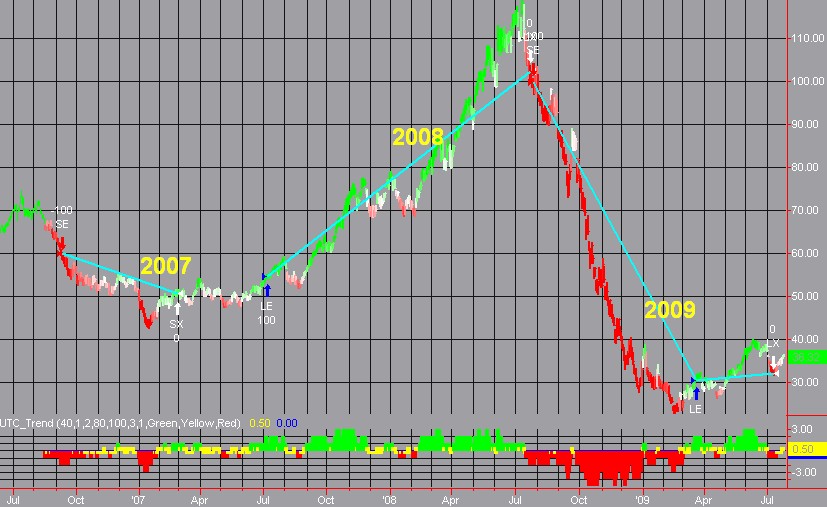
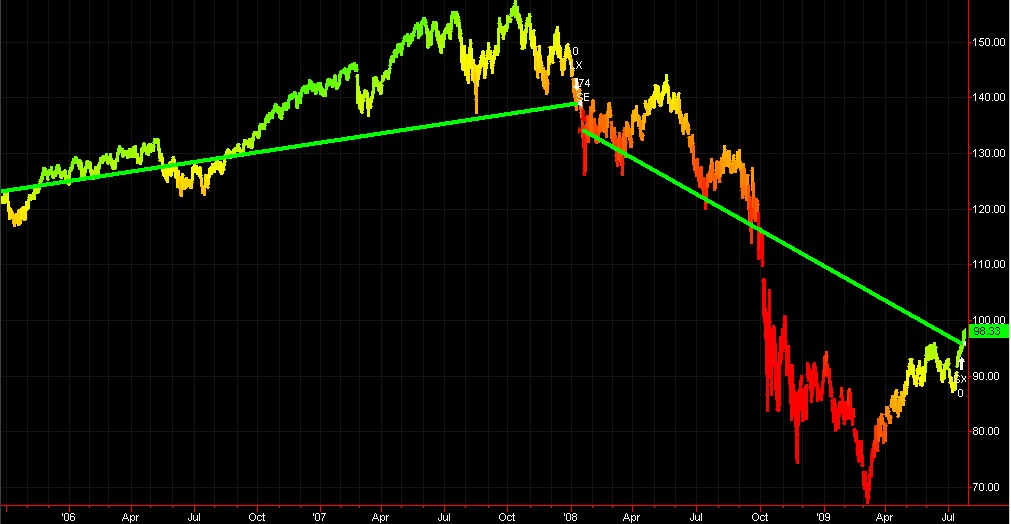
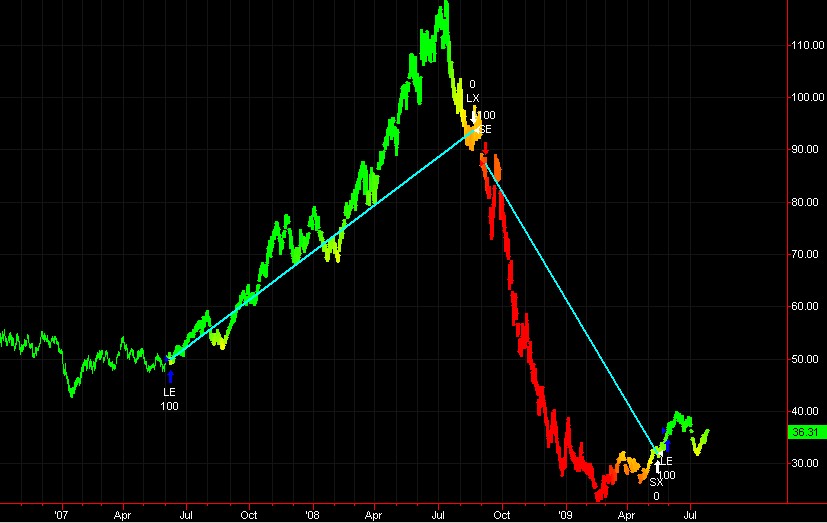
Here is an example (USO Oil July to Oct 2007) - showing the UT_Trend"
Indicator and the "UT_Bars" coloring tool:
RISK DISCLOSURE:
Futures and forex trading contains substantial risk and is not for every investor.
An investor could potentially lose all or more than the initial investment.
Risk capital is money that can be lost without jeopardizing one's financial security or life style.
Only risk capital should be used for trading and only those with sufficient risk capital should consider trading.
Past performance is not necessarily indicative of future results.
HYPOTHETICAL PERFORMANCE DISCLAIMER:
Hypothetical performance results have many inherent limitations, some of which are described below.
No representation is being made that any account will or is likely to achieve profits or losses similar to those shown;
in fact, there are frequently sharp differences between hypothetical performance results and
the actual results subsequently achieved by any particular trading program.
One of the limitations of hypothetical performance results is that they are generally prepared with the benefit of hindsight.
In addition, hypothetical trading does not involve financial risk, and no hypothetical trading record
can completely account for the impact of financial risk of actual trading.
For example, the ability to withstand losses or to adhere to a particular trading program in spite of trading losses are
material points which can also adversely affect actual trading results. There are numerous other factors related to
the markets in general or to the implementation of any specific trading program which cannot be fully accounted for in the preparation
of hypothetical performance results and all which can adversely affect trading results.
ADDITIONAL DISCLAIMER:
Professional Software Solutions(PSS), also known as PSS assumes no responsibility for your trading results.
Past performance does not guarantee future performance and Professional Software Solutions does not make any performance representations or guarantees.
Any chart or trading demonstration produced by Professional Software Solutions representing trades and using any systems/methods on the www.ProfSoftware.com website
or in any advertisement, seminar, brochure, magazine or online demonstrations are to be considered hypothetical trades for educational purposes only.
No trading system can guarantee profits. Hypothetical trading results can be unreliable.
Testimonials Disclosure:
Testimonials appearing on this website may not be representative of other clients or customers and is not a guarantee of future performance or success.
© Copyright 2004-2018, Burkhard Eichberger, Professional Software Solutions - All Rights Reserved Worldwide.