Effective backtesting is not trivial and a science in itself, here is a
brief introduction of the two main methods:
Method1: Common unrealistic Long term curve fitting Method
Usually you apply your trading strategy to a long period
(blue zone - called In-Sample-Test) and then optimize the result,
by running through many variations of several input parameter combinations in your
strategy (Permutations).
Out of all these permutations you then select the best result (Max equity, min draw down
etc)
and then start live trading with this optimized set of strategy parameter (red
zone - called Out-Of-Sample Test)
Below is a visual representation of this process:

As you might have experienced yourself - the likelihood of this optimized
(usually phantastic) result to repeat in the future is very slim,
and disappointing actual trading results usually occur, because just you have
"curve-fitted" the strategy input parameter to that particular long
period.
Optimizing your strategy on this overall maximum equity, is usually used by
various Genetic Optimizers.
Method2: Realistic Walk forward Strategy Backtesting and Optimization
of Filter/Sort/Period Settings
In the advanced "walk-forward" method, you
optimize on many shorter periods (In-Sample) and then
verify repeatedly in the "future" (Out-Of-Sample) if those strategy
parameter still produce favorable results
Below is a visual representation of the
walk-forward-backtesting and optimization (WFO) process:
In this example only the first 4 weeks (blue block - called the "In
Sample" period) were used in the back testing.
After all the many permutations of the strategy input parameters have been
calculated, the WFO filter is applied;
which eliminates many loosing or unrealistic results outright. Then the WFO
sort is applied - yielding one final permutation;
which is then applied in the following 5th week (green block - called the
"Out of Sample" period).
This process is repeated to all the available data (in this example 12 weeks,
with 8 WFO optimization runs);
each time the WFO filter and sort will select a different input parameter
permutation for the out-of-sample week.
Finally all separate out-of-sample results are joined and merged into the final
overall result.
The likelihood of repeating these results in the future in the "Out of
Sample" period is very high and
before you risk your capital our WFO tools provide you with a realistic
evaluation how your strategy would
perform in the real live market.
Furthermore you can test many different WFO filter and sort algorithms to find
the most effective WFO selection method.
This Walk Forward method has been used in the Grail Walk Forward Optimizer
(GWFO) (Grail is no longer available),
but does allow you to customize the filter and
sort methods, and daily or weekly periods and access the results on a exported
spreadheet!
Walk Forward Backtesting Process
Start the Walk Forward Process by clicking on on the  toolbar button (or from the menu Actions/Run WFO or Ctrl+R);
Here you can define the walk forward filter (how to eliminate permutations) and
the sort criteria (how to pick the best):
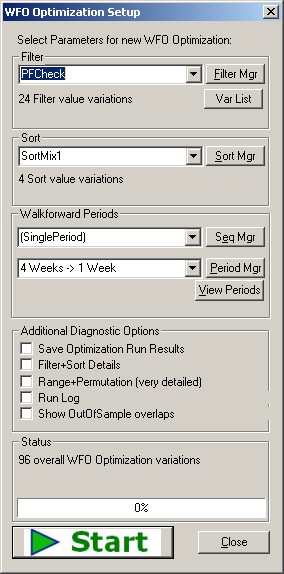 |
To see the filter click on the "FilterMgr"
button, shich will show the currently selected WF filter:
Formula=($PF >= PFMin) AND ($PF <= PFMax) AND ($MaxGainCnt > MaxGainCntMin) AND ($MaxLossCnt < MaxLossCntMax)
PFMin=1.0 to 1.2 step 0.2
PFMax=1.8 to 2.2 step 0.2
MaxGainCntMin=6,5
MaxLossCntMax=6,5
You can also see that you can vary any number of the filter formula, i.e
PFMin defines
the minimum ProfitFactor ($PF) required and we are testing 1.0 and 1.2 (PFMin=1.0 to 1.2 step 0.2).
In this example 24 total filter variations will be tested (2xPFMin,3xPFMax,2xMaxGain,2xMaxLoss).
The "Sort Mgr" allows you to define the various sort criteria to
be tested,
in our example SortMix1 contain 4 different sort criteria:
Sort1=$MaxTrdLoss/5 DESC,$Equity,$MaxDDAmt
Sort2=$Equity,$MaxDDAmt,$MaxTrdLoss DESC
Sort3=$PF,$Equity,$MaxTrdLoss DESC
Sort4=$PFAvg,$Equity,$MaxTrdLoss DESC
The "Period Mgr" allows you to select and even customize the
in-sample and out-sample periods.
In this example we run 4 weeks insample and test 1 week out of sample.
To see the actual walk forward periods being testing, click on the
"View Periods" button.
The "Seq Mgr" allows you build clusters of
different period definitions.
Example: Yu can create cluster with the following 4 period definitions:
4Week/1Week, 5Week/1Week,6Week/1Week,7Week/1Week
BWFMgr will the test each one and then you can compare the performance
directly!
Turn OFF all "Additional Diagnostic Options" to achive
maximum processing speed.
Click on START to initiate the walk forward process!
When it completes BTWFMgr will display a message and add the results to
the treeview (blue squares)
BTWFMgr can calculate in a few short moments, what would be a manual extensive and
error-prone effort.
The progress bars will indicate the progress of the "Walk Forward Process".
If you need the CPU power on your computer you can Pause and continue the
processing later. |
|
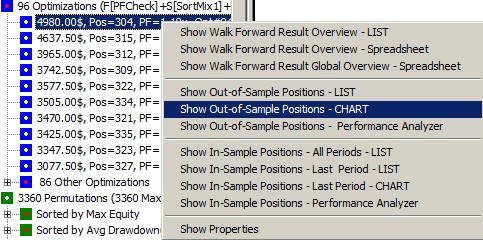 When the WF process has completed,
a new branch with all the 96 WF results
for each test run, is generate.
Just right click on any WF result and
select the requested function: usually the
Out-of-Sample Chart -or-
WF Result Overview - LIST (as shown below)
or click here
(ISA=In-Sample, OSA=Out-of-Sample, WF=Walk Forward)
|
| Period# |
In-Sample |
|
|
|
|
|
|
|| |
In-Sample-LastPeriod |
|| |
Out-of-Sample |
|
|
|
|
|| |
InputParameter |
|
|
|
|
|
StartDate |
StartDateL |
EndDate |
TrdPermID |
ISA-PL |
ISA-Hits |
ISA-PF |
|| |
ISAL-PL |
ISAL-Hits |
|| |
StartDate |
EndDate |
OSA-PL |
OSA-Equ |
OSA-Hits |
OSA-PL |
|| |
RSILength |
OverSold |
OverBought |
EMALength |
LossAmt |
GainAmt |
|
|
|
|
|
|
|
|
|
|
|
|
|
|
|
|
|
|
|
|
|
|
|
|
|
| 1 |
20050606 |
20050717 |
20050731 |
3260 |
3182.5 |
46 |
1.8 |
|| |
1360 |
13 |
|| |
20050801 |
20050814 |
1905 |
1905 |
14 |
3.5 |
|| |
20 |
46 |
64 |
20 |
180 |
220 |
| 2 |
20050620 |
20050731 |
20050814 |
136 |
3892.5 |
64 |
1.8 |
|| |
2497.5 |
18 |
|| |
20050815 |
20050828 |
85 |
1990 |
13 |
1.1 |
|| |
14 |
40 |
64 |
20 |
140 |
220 |
| 3 |
20050704 |
20050814 |
20050828 |
3256 |
3740 |
52 |
2 |
|| |
427.5 |
12 |
|| |
20050829 |
20050911 |
755 |
2745 |
14 |
1.7 |
|| |
20 |
46 |
64 |
20 |
140 |
220 |
| 4 |
20050718 |
20050828 |
20050911 |
872 |
4270 |
61 |
2 |
|| |
1000 |
15 |
|| |
20050912 |
20050925 |
660 |
3405 |
13 |
1.7 |
|| |
15 |
46 |
66 |
20 |
140 |
220 |
| 5 |
20050801 |
20050911 |
20050925 |
1724 |
4322.5 |
58 |
1.9 |
|| |
655 |
14 |
|| |
20050926 |
20051009 |
357.5 |
3762.5 |
11 |
1.4 |
|| |
17 |
44 |
62 |
20 |
180 |
220 |
| 6 |
20050815 |
20050925 |
20051009 |
1868 |
3292.5 |
49 |
1.9 |
|| |
550 |
10 |
|| |
20051010 |
20051023 |
427.5 |
4190 |
22 |
1.2 |
|| |
17 |
48 |
60 |
20 |
180 |
220 |
| 7 |
20050829 |
20051009 |
20051023 |
1884 |
2430 |
59 |
1.5 |
|| |
-177.5 |
23 |
|| |
20051024 |
20051106 |
0 |
4190 |
15 |
1 |
|| |
17 |
48 |
62 |
20 |
180 |
220 |
| 8 |
20050912 |
20051023 |
20051106 |
1868 |
2455 |
59 |
1.5 |
|| |
385 |
13 |
|| |
20051107 |
20051120 |
725 |
4915 |
10 |
1.9 |
|| |
17 |
48 |
60 |
20 |
180 |
220 |
| 9 |
20050926 |
20051106 |
20051120 |
1964 |
1800 |
50 |
1.4 |
|| |
825 |
10 |
|| |
20051121 |
20051204 |
20 |
4935 |
11 |
1 |
|| |
18 |
38 |
62 |
20 |
180 |
220 |
| 10 |
20051010 |
20051120 |
20051204 |
2816 |
1227.5 |
47 |
1.3 |
|| |
-232.5 |
9 |
|| |
20051205 |
20051218 |
927.5 |
5862.5 |
12 |
2 |
|| |
19 |
48 |
58 |
20 |
220 |
220 |
| 11 |
20051024 |
20051204 |
20051218 |
652 |
2352.5 |
52 |
1.5 |
|| |
1400 |
15 |
|| |
20051219 |
20060101 |
-187.5 |
5675 |
10 |
0.8 |
|| |
15 |
42 |
58 |
20 |
180 |
220 |
| 12 |
20051107 |
20051218 |
20060101 |
572 |
2587.5 |
45 |
1.7 |
|| |
5 |
9 |
|| |
20060102 |
20060115 |
-55 |
5620 |
11 |
1 |
|| |
15 |
40 |
58 |
20 |
180 |
220 |
| 13 |
20051121 |
20060101 |
20060115 |
764 |
2127.5 |
42 |
1.6 |
|| |
587.5 |
10 |
|| |
20060116 |
20060129 |
-410 |
5210 |
12 |
0.8 |
|| |
15 |
44 |
62 |
20 |
180 |
220 |
| 14 |
20051205 |
20060115 |
20060129 |
795 |
1982.5 |
41 |
1.6 |
|| |
100 |
10 |
|| |
20060130 |
20060212 |
-287.5 |
4922.5 |
15 |
0.8 |
|| |
15 |
44 |
66 |
20 |
180 |
180 |
| 15 |
20051219 |
20060129 |
20060212 |
993 |
1597.5 |
58 |
1.6 |
|| |
180 |
19 |
|| |
20060213 |
20060226 |
-52.5 |
4870 |
13 |
0.9 |
|| |
16 |
38 |
62 |
20 |
100 |
100 |
| 16 |
20060102 |
20060212 |
20060226 |
1073 |
1777.5 |
57 |
1.8 |
|| |
130 |
14 |
|| |
20060227 |
20060312 |
-250 |
4620 |
20 |
0.8 |
|| |
16 |
40 |
62 |
20 |
100 |
100 |
| 17 |
20060116 |
20060226 |
20060312 |
2168 |
2502.5 |
67 |
1.5 |
|| |
2407.5 |
16 |
|| |
20060313 |
20060326 |
635 |
5255 |
13 |
1.7 |
|| |
18 |
44 |
58 |
20 |
140 |
220 |
| 18 |
20060130 |
20060312 |
20060326 |
2168 |
4185 |
63 |
2 |
|| |
635 |
13 |
|| |
20060327 |
20060409 |
517.5 |
5772.5 |
24 |
1.3 |
|| |
18 |
44 |
58 |
20 |
140 |
220 |
| 19 |
20060213 |
20060326 |
20060409 |
2332 |
3887.5 |
55 |
1.9 |
|| |
1197.5 |
18 |
|| |
20060410 |
20060423 |
-415 |
5357.5 |
13 |
0.8 |
|| |
18 |
48 |
58 |
20 |
180 |
220 |
| 20 |
20060227 |
20060409 |
20060423 |
1724 |
3112.5 |
55 |
1.7 |
|| |
-107.5 |
9 |
|| |
20060424 |
20060507 |
597.5 |
5955 |
13 |
1.5 |
|| |
17 |
44 |
62 |
20 |
180 |
220 |
| 21 |
20060313 |
20060423 |
20060507 |
616 |
2390 |
52 |
1.6 |
|| |
640 |
12 |
|| |
20060508 |
20060521 |
-1135 |
4820 |
12 |
0.4 |
|| |
15 |
40 |
64 |
20 |
140 |
220 |
| 22 |
20060327 |
20060507 |
20060521 |
2353 |
1107.5 |
66 |
1.3 |
|| |
-507.5 |
14 |
|| |
20060522 |
20060604 |
160 |
4980 |
13 |
1.2 |
|| |
18 |
48 |
62 |
20 |
100 |
100 |
| 23 |
20060410 |
20060521 |
20060604 |
3237 |
1060 |
53 |
1.3 |
|| |
237.5 |
15 |
|| |
20060605 |
20060618 |
0 |
4980 |
0 |
0 |
|| |
20 |
46 |
62 |
20 |
140 |
100 |
Period Manager
The Walk Forward "Period Mgr" allows you to select and even customize the in-sample and out-sample periods.
In this example above we run 4 weeks InSample and test 1 week out of sample.
To see the actual walk forward periods being testing, click on the "View Periods" button.
You can fin tune the periods using the following parameters in the "Walk Forward Optimization"
config section
| WFODayShift |
Number of Days to shift from the calculated default dates:
negative=backwards shift positive=forward shift Zero=no additional date shift |
| WFOBack |
Run Walk Forward period creation from the back/last date (default from front/first date) |
| WFOWeekMonday |
TRUE: For Weekly Periods - Adjusts the dates to always start on a Monday |
| WFOAddPeriod |
Number of periods to append without historical data\nDefault = one(1) period for the first future period |
| OSAStyle |
Define how Walk Forward Out Of Sample Positions are handled which cross/overlap across the begin or end of the OSA
Period:
0 = include all overlapped positions in OSA Period
1 = Exclude ending/last overlapped position from OSA period
2 = Exclude the starting/first overlapped position from OSA period
3 = Exclude the starting/first and ending/last overlapped position from OSA period |
| OSAStyleVerbose |
Switch OSA Overlap Check verbose mode ON/OFF |
| MaxWFOOpt |
Maximum number of Walk Forward Optimizations to show directly in the
Treeview (Default=10)
The remaining results are shown in the Other results branch |
| NormWFEqu |
Normalize the WalkFwd Equity to the full period (default NO)
Example: 50 Weeks of data using 10week ISA and 5week OSA would amplify by a factor of 25% (50/40) |
| WFAVerbose |
Walk Forward diagnostic verbose level (0=none, 1=write diags to log) |
| WFOMaxOSAPerm |
Number of parallel OutOfSample top permutations used (1=only top result, 5=Use 5 Top results and accumulate positions) |
| WFOMaxOSAPos |
Number of parallel OutOfSample position in same bar (0=unlimited) |
| WFODiagPeriod |
Specify the Walk Forward Period - to show detailed WFOMaxOSAPos calculations in Log File (0=no diagnostic)
Example Diagnostic File PosDiag.txt
Processing Period#1
Processing Period: ISA 20131231 -> 20140127
Processing WalkFwdOpt#1
...
Checking Pos#00006 (Ranges= 4, Bar 474 -> 550): Vol=271 Short, Entry=20140131 10:30:00(36.8000), Exit=20140205 10:00:00(36.1300), PL=173.57$,
Perm=45
Detected 4 Overlap(s) (Max=3)
...
Deleting 13 overlapping positions
Processing WalkFwdOpt#2
Processing WalkFwdOpt#3
Processing WalkFwdOpt#4 |
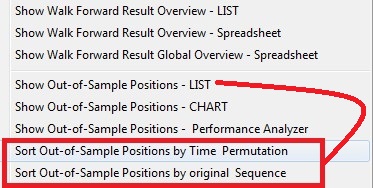
| SortPosByTime |
Sort WalkFwd OSA Positions by Time Only (YES) - otherwise original Sequence (NO)
You can also change the OSA Position sorting via the new right click Menu
choices:
 |
| FindBarNbr |
This switch in the "Initial Data Conversion" section - which
allows you to force a FRESH search to find the Bar Number for each
position
(usually provided by the backtesting data!) |
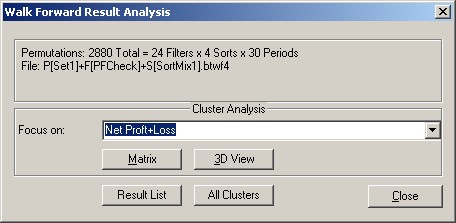
Displaying Walk Forward Results in 3D
Select Tools/Walk Forwared Results+Cluster Analysis.
Then select for example "Net Profit+Loss" and click on "3D
View":
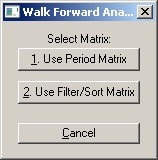
Click on the X/Y selection you would like to view (Example Period Matrix):
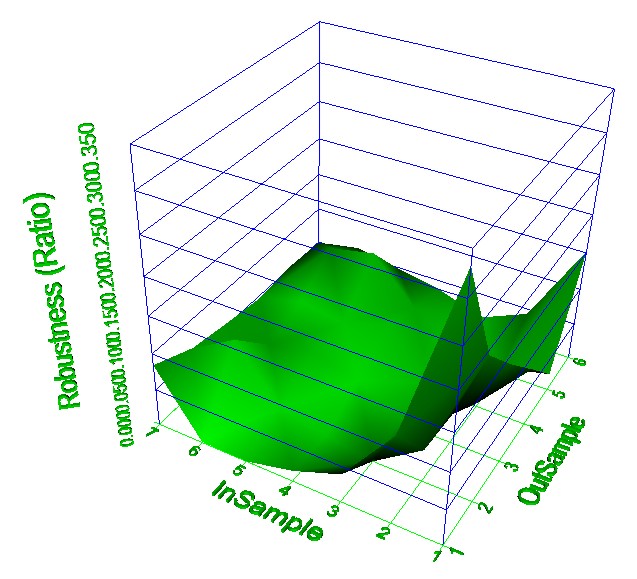
Now the three dimensional view appears -
were you can easily identify the various peaks with the best performance:

Another example is the 3D View of the "BTWFMgr Robustness":
The BTWFMgr Robustness is the calculated as the ratio between
InSample and OutSample Profit/Loss,
but adjusted for the
InSample/OutSample length -
because the
InSample period is usually much longer than the OutSample period:
A Robustness of 1.00 indicates a perfect match between the projected InSample
result and the actual OutSample result,
a robustness of 0.35(35%) indicates that the OutSample reached 35% of the
extpected InSample Profit:
The same walk forward result matrix can also be viewed as a spreadsheet.
Just click on "Matrix" instead of the "3D View" and
then same view is exported and displayed as a spreadsheet:
(as a CSV file in the same folder with e*.btwf4 Walk Fwd data file)
| NET PROFT+LOSS ($) |
|
|
|
|
|
|
|
|
|
|
|
|
|
|
|
|
|
|
|
|
|
|
|
|
|
|
(96
Values per cell) |
|
|
|
|
|
|
|
|
|
|
|
|
10% |
15% |
20% |
25% |
30% |
ALL |
|
|
|
|
|
|
|
| 5 Runs |
685.63 |
429.61 |
427.42 |
-942.34 |
-1770.47 |
-234.03 |
|
|
|
|
|
|
|
| 10 Runs |
-20.78 |
-1176.09 |
-1641.67 |
-5310.83 |
-2263.31 |
-2082.54 |
|
|
|
|
|
|
|
| 15 Runs |
-842.92 |
-3520.47 |
-2228.59 |
-2094.9 |
-2040.6 |
-2145.49 |
|
|
|
|
|
|
|
| 20 Runs |
-3107.4 |
-2624.66 |
-1246.15 |
-39.24 |
-897.08 |
-1582.91 |
|
|
|
|
|
|
|
| 25 Runs |
-5432.81 |
-1490.13 |
-1166.17 |
-497.14 |
1375.94 |
-1442.06 |
|
|
|
|
|
|
|
| 30 Runs |
-2656.56 |
116.74 |
-1122.29 |
422.6 |
1188.7 |
-410.16 |
|
|
|
|
|
|
|
| ALL |
-1895.81 |
-1377.5 |
-1162.91 |
-1410.31 |
-734.47 |
-817.76 |
|
|
|
|
|
|
|
|
|
|
|
|
|
|
|
|
|
|
|
|
|
| NET
PROFT+LOSS ($) |
|
|
|
|
|
|
|
|
|
|
|
|
|
|
|
|
|
|
|
|
|
|
|
|
|
|
(30
Values per cell) |
|
|
|
|
|
|
|
|
|
|
|
|
Sort1 |
Sort2 |
Sort3 |
Sort4 |
ALL |
|
|
|
|
|
|
|
|
| Filter1 |
-96.17 |
-1243 |
-2542.83 |
298.67 |
-895.83 |
|
|
PFMin=1|PFMax=1.8|MaxGainCntMin=6|MaxLossCntMax=6 |
| Filter2 |
-1181.42 |
-2796.33 |
-2538 |
-13.42 |
-1632.29 |
|
|
PFMin=1.2|PFMax=1.8|MaxGainCntMin=6|MaxLossCntMax=6 |
| Filter3 |
-184 |
-1214.83 |
-3072.42 |
-94.5 |
-1141.44 |
|
|
PFMin=1|PFMax=2|MaxGainCntMin=6|MaxLossCntMax=6 |
| Filter4 |
-1252.92 |
-2581.58 |
-3240.75 |
-393.5 |
-1867.19 |
|
|
PFMin=1.2|PFMax=2|MaxGainCntMin=6|MaxLossCntMax=6 |
| Filter5 |
-261.92 |
-1235.83 |
-3153.75 |
61.33 |
-1147.54 |
|
|
PFMin=1|PFMax=2.2|MaxGainCntMin=6|MaxLossCntMax=6 |
| Filter6 |
-1274.5 |
-2721.5 |
-3283.08 |
-297.75 |
-1894.21 |
|
|
PFMin=1.2|PFMax=2.2|MaxGainCntMin=6|MaxLossCntMax=6 |
| Filter7 |
-155.5 |
-1279.92 |
-2779.33 |
825.5 |
-847.31 |
|
|
PFMin=1|PFMax=1.8|MaxGainCntMin=5|MaxLossCntMax=6 |
| Filter8 |
-1005.42 |
-2831.33 |
-2519.5 |
860.67 |
-1373.9 |
|
|
PFMin=1.2|PFMax=1.8|MaxGainCntMin=5|MaxLossCntMax=6 |
| Filter9 |
-381.67 |
-1352.75 |
-3291.75 |
836.33 |
-1047.46 |
|
|
PFMin=1|PFMax=2|MaxGainCntMin=5|MaxLossCntMax=6 |
| Filter10 |
-1348.5 |
-2982.67 |
-2962.5 |
894.92 |
-1599.69 |
|
|
PFMin=1.2|PFMax=2|MaxGainCntMin=5|MaxLossCntMax=6 |
| Filter11 |
-349.92 |
-1345.42 |
-3446.92 |
1050.17 |
-1023.02 |
|
|
PFMin=1|PFMax=2.2|MaxGainCntMin=5|MaxLossCntMax=6 |
| Filter12 |
-1349 |
-2822.42 |
-3173.08 |
1069.5 |
-1568.75 |
|
|
PFMin=1.2|PFMax=2.2|MaxGainCntMin=5|MaxLossCntMax=6 |
| Filter13 |
228.08 |
-986.42 |
-2221.42 |
-447.5 |
-856.81 |
|
|
PFMin=1|PFMax=1.8|MaxGainCntMin=6|MaxLossCntMax=5 |
| Filter14 |
-1062.67 |
-2268.25 |
-2664.5 |
-462.17 |
-1614.4 |
|
|
PFMin=1.2|PFMax=1.8|MaxGainCntMin=6|MaxLossCntMax=5 |
| Filter15 |
73.75 |
-955.42 |
-2472.83 |
-650.33 |
-1001.21 |
|
|
PFMin=1|PFMax=2|MaxGainCntMin=6|MaxLossCntMax=5 |
| Filter16 |
-1125.42 |
-2258.17 |
-3187.17 |
-701.67 |
-1818.1 |
|
|
PFMin=1.2|PFMax=2|MaxGainCntMin=6|MaxLossCntMax=5 |
| Filter17 |
15.67 |
-922.5 |
-2543.67 |
-521.33 |
-992.96 |
|
|
PFMin=1|PFMax=2.2|MaxGainCntMin=6|MaxLossCntMax=5 |
| Filter18 |
-1120.25 |
-2211.92 |
-3259.42 |
-579.33 |
-1792.73 |
|
|
PFMin=1.2|PFMax=2.2|MaxGainCntMin=6|MaxLossCntMax=5 |
| Filter19 |
39.08 |
-1183.5 |
-2239.42 |
59.08 |
-831.19 |
|
|
PFMin=1|PFMax=1.8|MaxGainCntMin=5|MaxLossCntMax=5 |
| Filter20 |
-870.17 |
-2153.25 |
-2449.08 |
65.58 |
-1351.73 |
|
|
PFMin=1.2|PFMax=1.8|MaxGainCntMin=5|MaxLossCntMax=5 |
| Filter21 |
-90.5 |
-1315.25 |
-2580.75 |
46.83 |
-984.92 |
|
|
PFMin=1|PFMax=2|MaxGainCntMin=5|MaxLossCntMax=5 |
| Filter22 |
-1073.67 |
-2361.58 |
-3057.83 |
-55.58 |
-1637.17 |
|
|
PFMin=1.2|PFMax=2|MaxGainCntMin=5|MaxLossCntMax=5 |
| Filter23 |
-268.17 |
-1219.58 |
-2784.75 |
194 |
-1019.63 |
|
|
PFMin=1|PFMax=2.2|MaxGainCntMin=5|MaxLossCntMax=5 |
| Filter24 |
-1088.25 |
-2357.08 |
-3231.42 |
79.5 |
-1649.31 |
|
|
PFMin=1.2|PFMax=2.2|MaxGainCntMin=5|MaxLossCntMax=5 |
| ALL |
-632.64 |
-1858.35 |
-2862.34 |
88.54 |
-817.76 |
|
|
|
|
|
|
|
|
|
Sort1=$MaxTrdLoss/5
DESC|$Equity|$MaxDDAmt |
|
|
|
|
|
|
|
|
|
|
Sort2=$Equity|$MaxDDAmt|$MaxTrdLoss
DESC |
|
|
|
|
|
|
|
|
|
|
Sort3=$PF|$Equity|$MaxTrdLoss
DESC |
|
|
|
|
|
|
|
|
|
|
|
Sort4=$PFAvg|$Equity|$MaxTrdLoss
DESC |
|
|
|
|
|
Running a Sequence of Walk Forward
Configurations
You can save and reload any WalkFwd configuration
(Filter, Sort and Period definition) and even
define and run a sequence of configurations!
| 1. |
Select the Filter, Sort and Period settings
you would like to save as a WalkFwd configuration |
| 2. |
Click on "Save Config" button and enter your new
name (Cfg1, etc) |
| 3. |
You can reload any of the saved WalkFwd configurations,
just click on "Load Config" and select the requested
Configuration. |
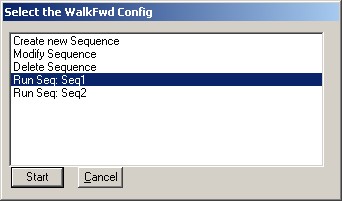
| 4. |
To define a WalkFwd Sequence:
a) Click on "Sequence" and select "Create new
Sequence"
b) Enter the new name (Seq1 etc)
c) In the new window, just list the configurations, separated by a comma
(Cfg1,Cfg2 etc) |
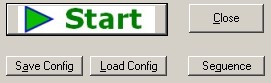
| 5. |
To run a WalkFwd sequence:
a) Click on the "Sequence" button
b) Click on Sequence you would like to run (Run Seq: SeqXXX)
c) Click on "Start"
d) Confirm starting the new WalkWd Sequence:
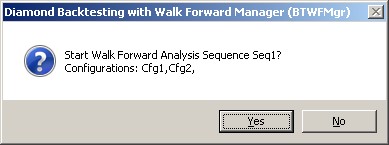
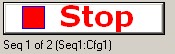
e) The WalkFwd optimization will start and show you
the current Sequence and COnfiguration being
calculated:
 |
| 6. |
Modify WalkFwd Sequence:
a) Click on the "Sequence" button
b) Click on "Modify Sequence"
c) Select the sequence to modify
d) Edit the Sequence in the new Notepad edit window and save/exit |
| 7. |
Delete a WalkFwd Sequence:
a) Click on the "Sequence" button
b) Click on "Delete Sequence"
c) Select the sequence to modify
d) Confirm the deletion |
| 8. |
File syntax:
WalkFwd Configurations are stored in the C:/BTWFMgr base folder as
WF{Cfg}.txt:
Example:
Filter=PFCheck
Sort=SortMix2
Sequence=Daily
WalkFwd Sequences are stored in the C:/BTWFMgr base folder as
WS{Cfg}.txt
Example:
Cfg1,Cfg2, |
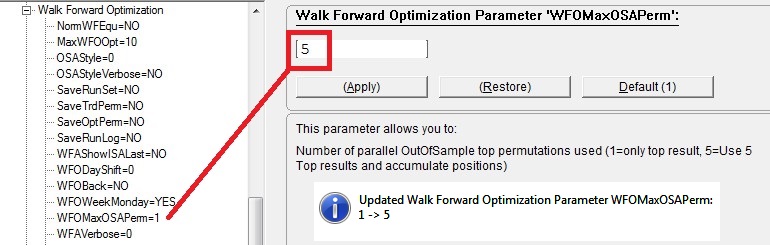
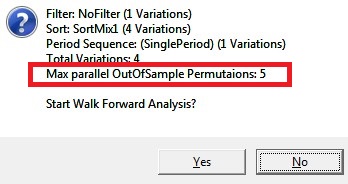
Parallel
OutOfSample(OSA) Permutations
To activate the parallel OutOfSample(OSA) function -
adjust the "WFOMaxOSAPerm" parameter
to the number of parallel OutOfSample top permutations used - Example: 5
Open the Walk Forward Optimization Box and start your optimization.
You will notice a new message - showing the parallel OSA permutations in the
confirmation box:
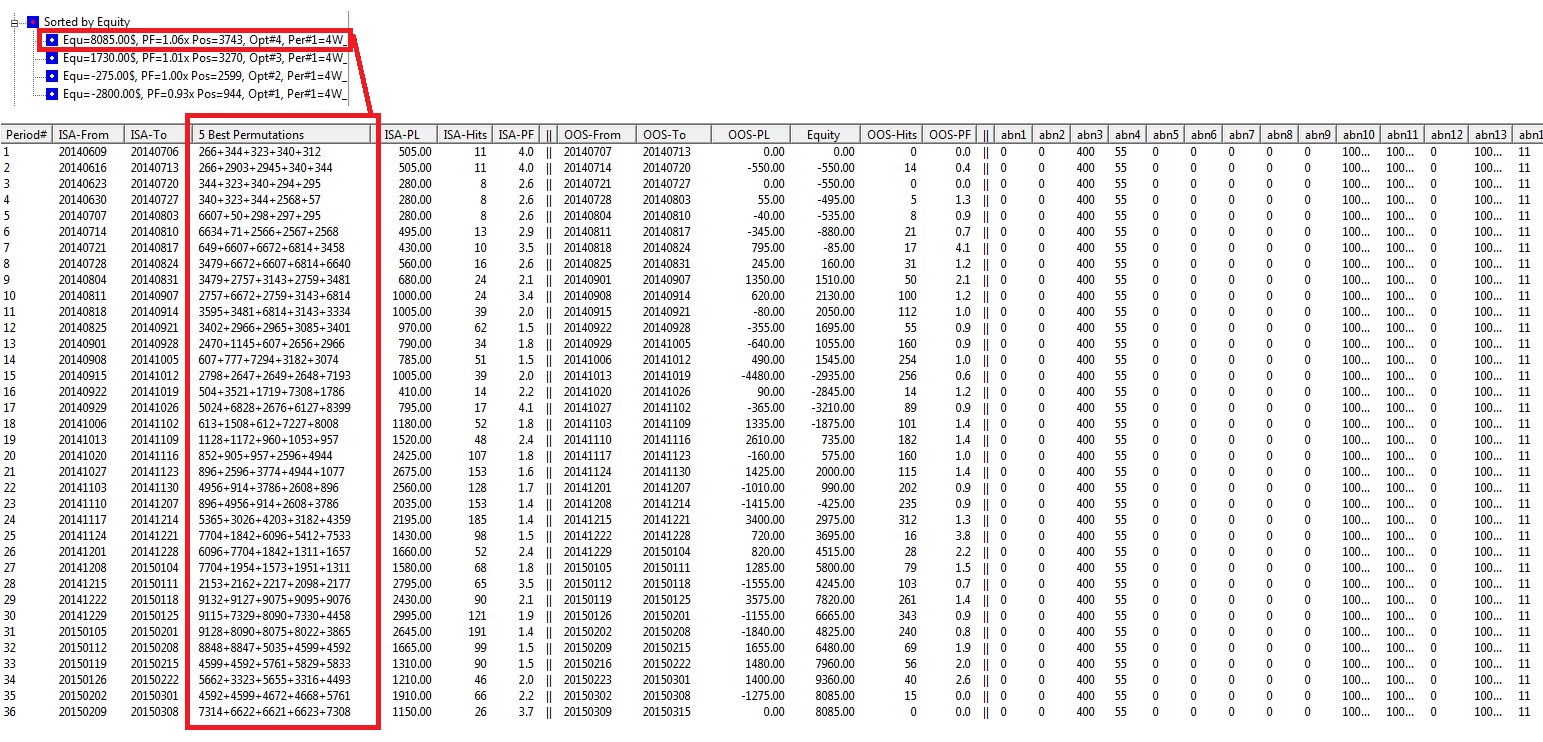
When you view the result - via the "Show Walk Forward Result Overview -
LIST",
you see the new "5 Best Permutations" column - which shows all the top
5 permutations from the filtered and sorted Walk Forward results:
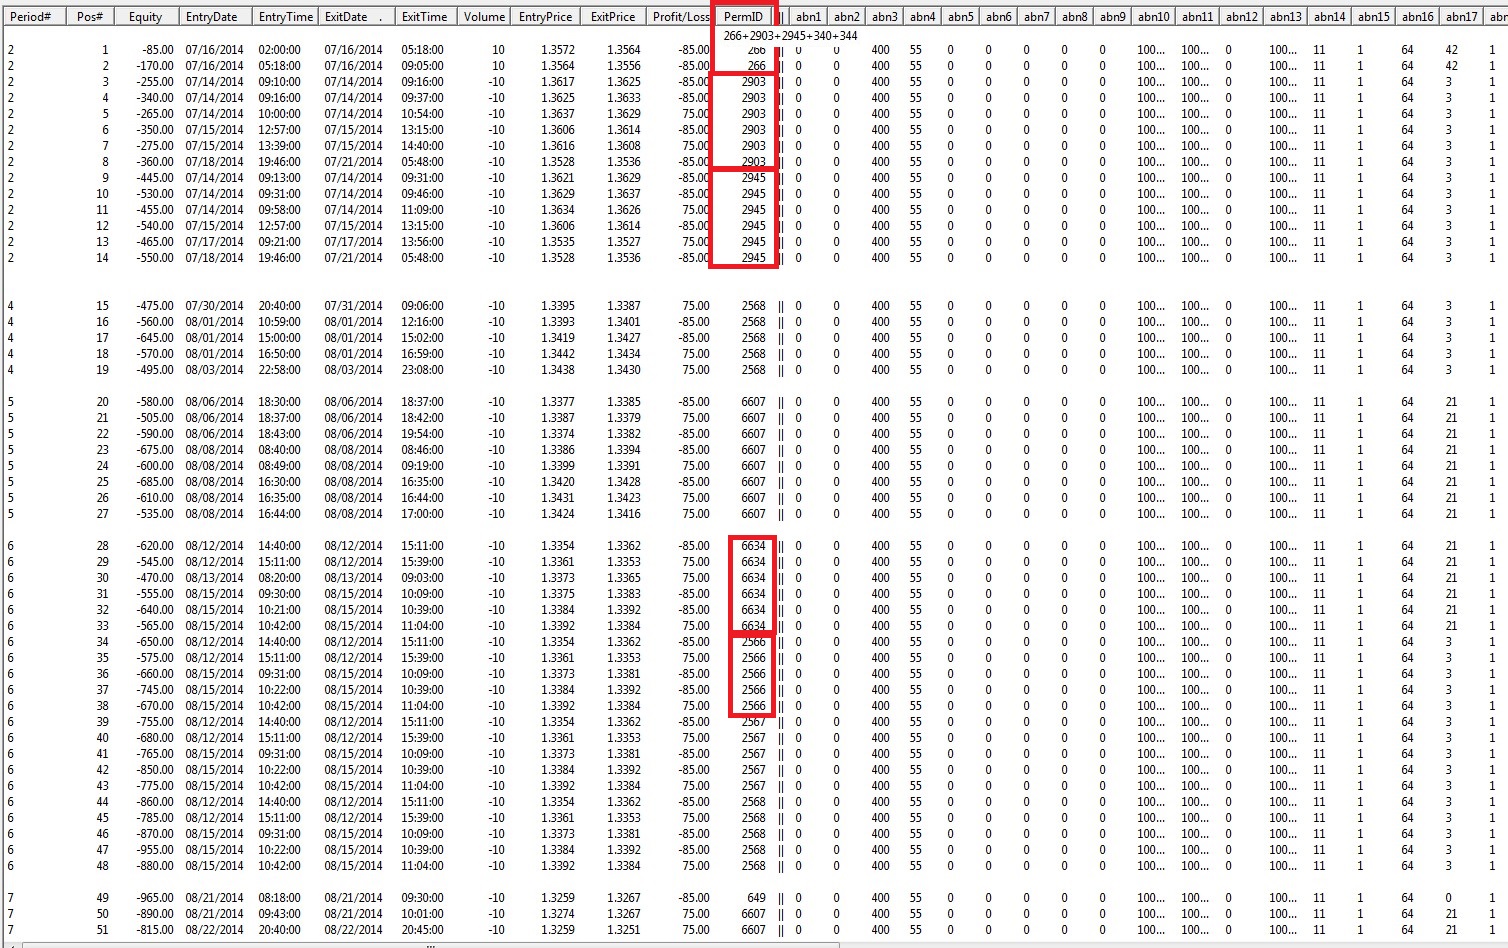
When you view the actual OSA trades - via the "Show Out-of-Sample Positions -
LIST",
you see the trades from MULTIPLE Permutations: 266+2903+2945, Note: Some
permutations do not have any trades in the Out-of-Sample periods (340, 344)!
RISK DISCLOSURE:
Futures and forex trading contains substantial risk and is not for every investor.
An investor could potentially lose all or more than the initial investment.
Risk capital is money that can be lost without jeopardizing one's financial security or life style.
Only risk capital should be used for trading and only those with sufficient risk capital should consider trading.
Past performance is not necessarily indicative of future results.
HYPOTHETICAL PERFORMANCE DISCLAIMER:
Hypothetical performance results have many inherent limitations, some of which are described below.
No representation is being made that any account will or is likely to achieve profits or losses similar to those shown;
in fact, there are frequently sharp differences between hypothetical performance results and
the actual results subsequently achieved by any particular trading program.
One of the limitations of hypothetical performance results is that they are generally prepared with the benefit of hindsight.
In addition, hypothetical trading does not involve financial risk, and no hypothetical trading record
can completely account for the impact of financial risk of actual trading.
For example, the ability to withstand losses or to adhere to a particular trading program in spite of trading losses are
material points which can also adversely affect actual trading results. There are numerous other factors related to
the markets in general or to the implementation of any specific trading program which cannot be fully accounted for in the preparation
of hypothetical performance results and all which can adversely affect trading results.
ADDITIONAL DISCLAIMER:
Professional Software Solutions(PSS), also known as PSS assumes no responsibility for your trading results.
Past performance does not guarantee future performance and Professional Software Solutions does not make any performance representations or guarantees.
Any chart or trading demonstration produced by Professional Software Solutions representing trades and using any systems/methods on the www.ProfSoftware.com website
or in any advertisement, seminar, brochure, magazine or online demonstrations are to be considered hypothetical trades for educational purposes only.
No trading system can guarantee profits. Hypothetical trading results can be unreliable.
Testimonials Disclosure:
Testimonials appearing on this website may not be representative of other clients or customers and is not a guarantee of future performance or success.
© Copyright 2004-2018, Burkhard Eichberger, Professional Software Solutions - All Rights Reserved Worldwide.
